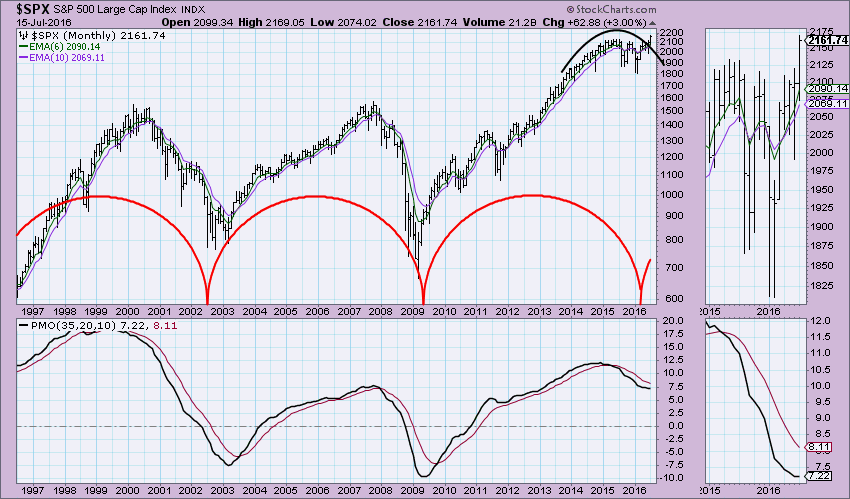
Let me first profess that I am not an avid follower of cycle charts. They generally take too much tinkering for my taste as they never quite fit over the long haul. However, as I was flipping through some of my longer-term charts, I ran into a chart I created last year. I was determining visually whether the very long-term bull and bear market cycles were telling us anything regarding that first large correction of the year. My sense was that we were extraordinarily vulnerable to a deep correction/bear market and the cycles were lining up.
Carl's last DecisionPoint blog entry was titled "Wait! Was That a Bear Market?" (recommended read!). This cycle chart could be suggesting that the market has run through its "correction" or "bear market". The Price Momentum Oscillator (PMO) is now beginning to turn up. The clear breakout from the rounded top and above all-time highs does seem to imply there is a new bull market leg in the making. **Remember this monthly chart will not go final until the end of the month so quite a bit can happen to the PMO between now and then.
Conclusion: I am not a cheerleader for a new bull market beginning based on indicators and the steep angle of ascent this rally (see DP Alert blog). However, this chart does support many of my readers' and viewers' opinions that the worst is behind us.
Come check out the DecisionPoint Report with Erin Heim on Wednesdays and Fridays at 7:00p EST, a fast-paced 30-minute review of the current markets mid-week and week-end. The archives and registration links are on the Homepage under “What’s New”.
Technical Analysis is a windsock, not a crystal ball.
Happy Charting!
- Erin

