Before looking at some patterns and breakouts, let's first review the basic of the flag pattern. Flags are continuation patterns that depend on the prior move for a directional bias. Flags are bullish continuation patterns when the prior move was up and bearish continuation patterns when the prior move was down. A bullish flag can be flat or have a downward slope, while bearish flags can be flat or have an upward slope.
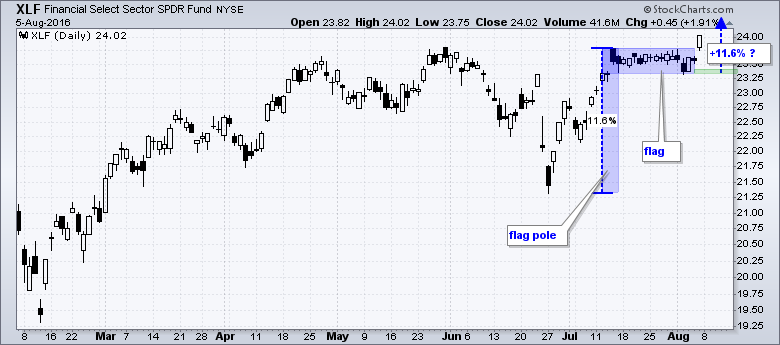
A variety of bullish flags formed in the finance sector over the last few weeks and big gaps on Friday triggered breakouts. First, the chart above shows the Finance SPDR (XLF) with a flat flag, a gap and a breakout. Flags typically fly at half-mast and this means chartists can measure the flagpole for an upside target. XLF gained 11.6% on the flagpole advance and another 11.6% move from the flag lows would target a move to around 26. After a flag breakout, chartists can use the flag lows to mark first support. Failure to hold the gap and a move below the flag lows would be quite negative.
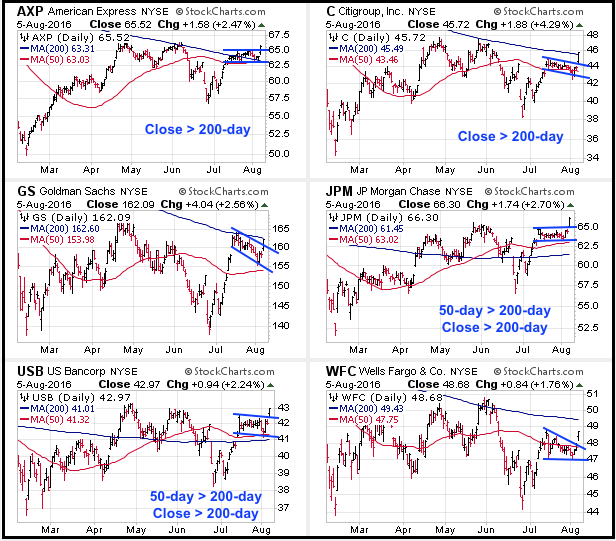 The next image shows six CandleGlance charts and a variety of flags (flat, falling and wedge). Even though a wedge (AXP) is not a flag per se, it does represent a short-term correction after an advance. AXP, JPM and USB are the strongest on the price charts because they are above their 50-day SMAs and 200-day SMAs. C, WFC and GS have flag breakouts working and are above their 50-day SMAs. C closed above its 200-day on Friday. Note that JPM and USB are the only two where the 50-day is above the 200-day. Thus, based on the charts, I would say JPM and USB are the strongest of these six.
****************************************
Thanks for tuning in and have a good weekend!
--Arthur Hill CMT
Plan your Trade and Trade your Plan
*****************************************


