A regular DecisionPoint webinar viewer and reader emailed me and suggested I take a look at AT&T because as he stated, "ouch". It was definitely a rough day for AT&T and what happened today has some very interesting implications.
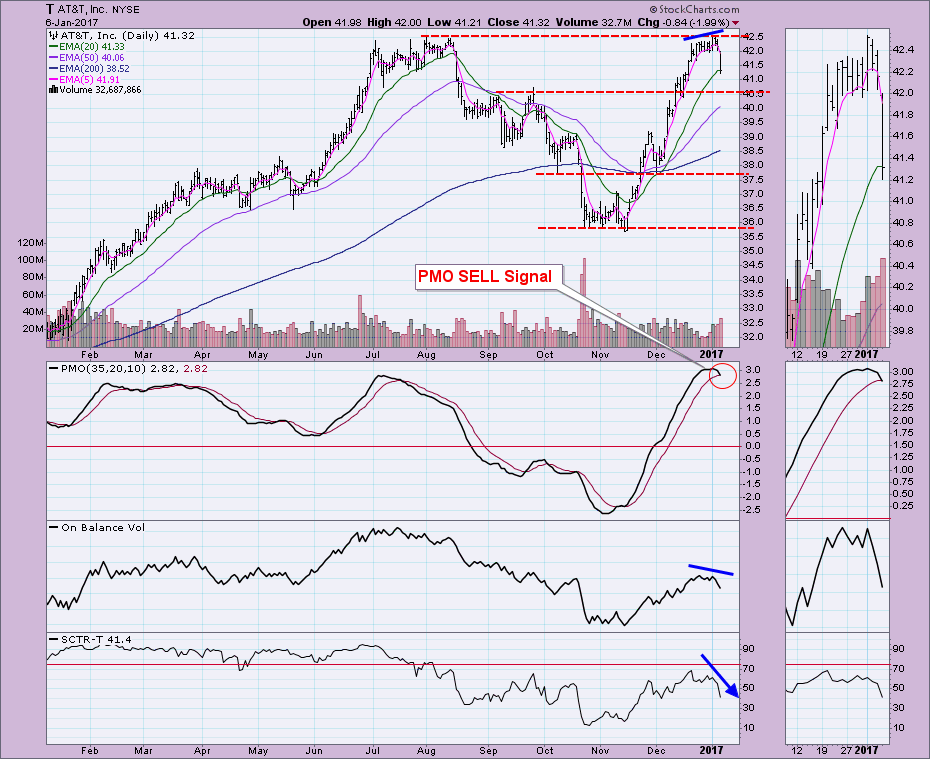
Price dropped almost 2% today. It came right after the negative divergence materialized between price tops and OBV tops. It also came after two unsuccessful tests of overhead resistance. The Price Momentum Oscillator (PMO) triggered a SELL signal as it crossed below its signal line today and also pierced the 20-EMA. Optimistically, price could find support at $40.50, but given the location of the PMO SELL signal and declining SCTR, I suspect it will drop much further.
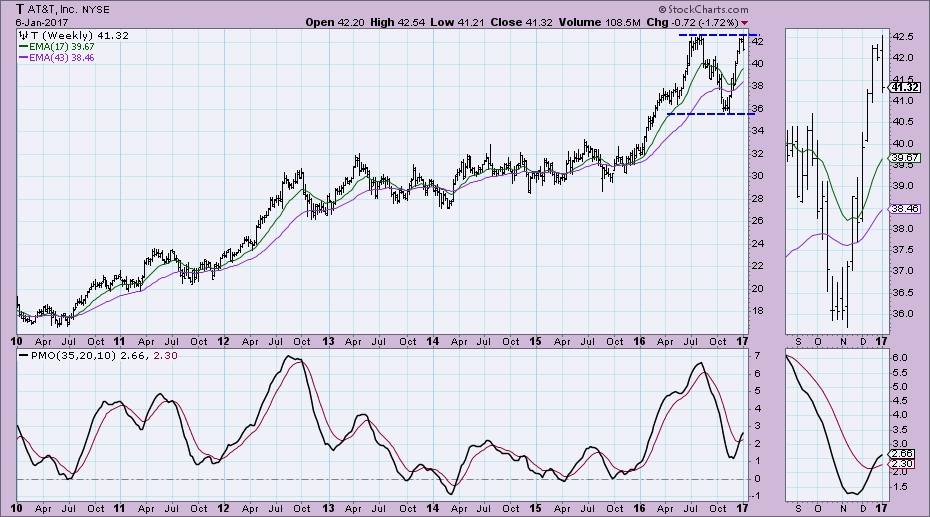
 The weekly chart could be positive given the rising PMO, but noting that price turned down at all-time highs after an unsuccessful test of resistance is a problem. The long-term implications could mean a move all the way down to $36, but I'd need to see the weekly PMO at least top and have a crossover SELL signal before I got that pessimistic. At this point, a move to $40.50, suggested by daily chart horizontal support seems likely.
The NEW DecisionPoint LIVE public ChartList has launched! Click on the link and you'll find webinar charts annotated just before the program. Additional "chart spotlights" will be included at the top of the list. Be sure and bookmark it!
Come check out the DecisionPoint Report with Erin Heim on Wednesdays and Fridays at 7:00p EST, a fast-paced 30-minute review of the current markets mid-week and week-end. The archives and registration links are on the Homepage under “Webinars”.
Technical Analysis is a windsock, not a crystal ball.
Happy Charting!
- Erin

