I've been writing relentlessly about the relative strength in energy shares (XLE) over the past several months and here I go again. Go ahead and talk about too much supply. Hang onto the weakening demand argument if you'd like. I'm simply following the charts which is what technicians do. The stock market knows ALL of the fundamental information and it's been priced in. And what the market keeps telling me is that you want to overweight energy. It's that simple and until rotation strips away that technical strength, I'll keep riding this horse. The following chart shows both the absolute and relative performance of energy. Check it out:
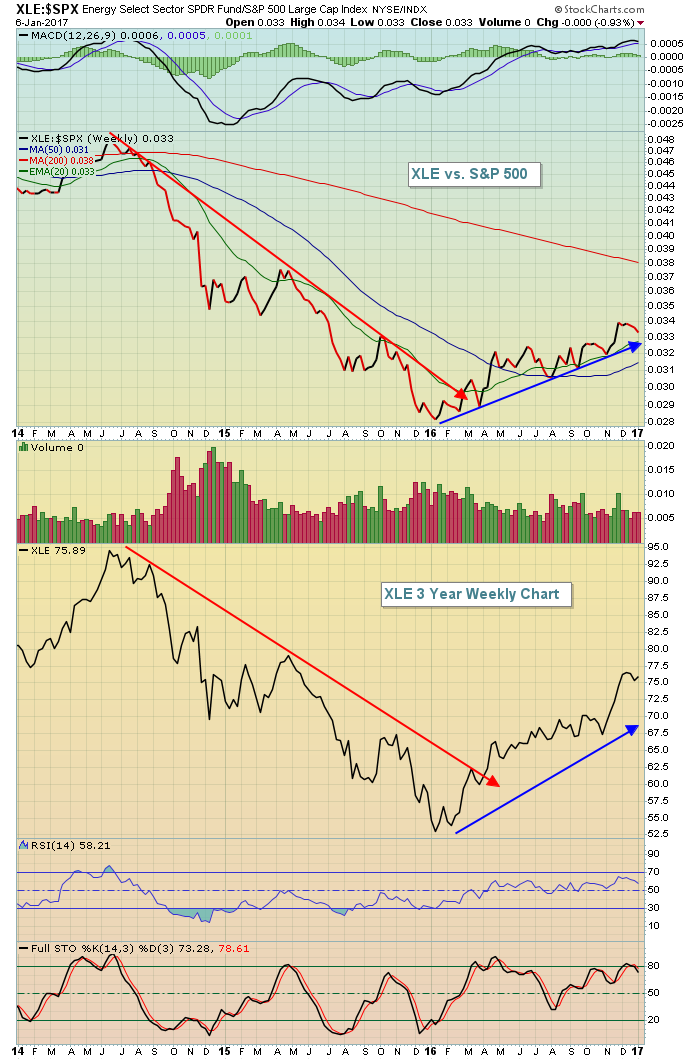 The lower price chart is the absolute price chart for the XLE. You can see that the downtrend ended in early 2016 and we continue to see strength and an uptrend in place. But that's not all because the upper price chart shows that not only is energy rising, but it's rising faster than the S&P 500. This guarantees us nothing about future performance, but what I can tell you - from researching the sector ETF seasonality charts - is that energy is approaching its three best calendar months for outperformance relative to the S&P 500 and doing so with a very strong technical chart pattern. For more information on the XLE's seasonal strength (and all the sectors' relative strength by calendar month), check out an article in my Trading Places blog that I just posted this morning, "Summary of Sector Relative Strength by Calendar Month".
After checking out that seasonal information, please be sure to register for a brand new webinar series that Greg Schnell and I will be hosting beginning next Saturday, January 14, 2017 at 11am EST. It's a 2017 Stock Market Outlook. During that webinar, Greg and I will both share our views on 2017 and I plan to combine both historical and technical information to forecast areas that you may want to consider in your own trading or investing strategy. CLICK HERE to register for this FREE (for StockCharts.com members) webinar. If you're not already a member, now is the best time to sign up for a 10 Day FREE Trial. That will give you a great opportunity to check out all the paid features and tools over the next couple weeks while also enjoying our webinar next weekend.
I want to wish everyone a very happy new year and of course.....
Happy trading!
Tom


