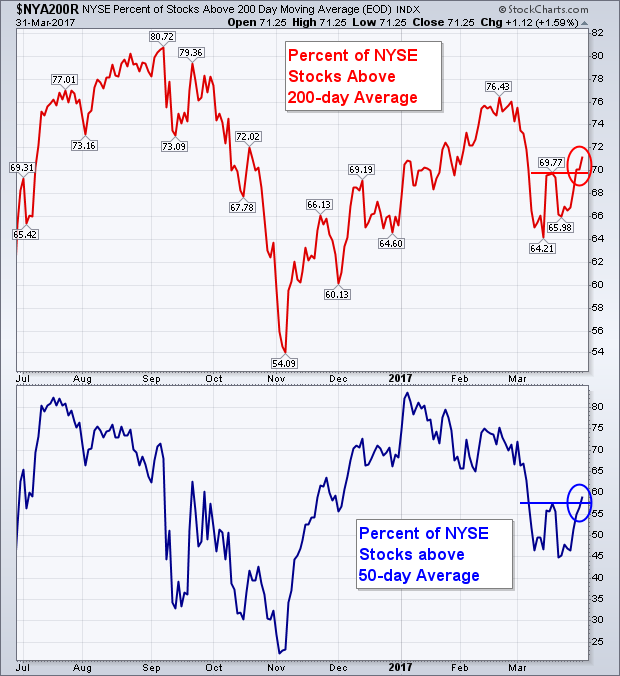
My last two messages have stressed the importance of the 200-day moving average. It's what separates uptrends from downtrends. In order to sustain a bull market, more stocks have be above their 200-day average than below it. And that is currently the case. The red line in Chart 5 is the percent of NYSE stocks above their 200-moving average (which I also showed on Thursday). The line rebounded from 54% just prior to the November election to 76% during February. March's modest setback lowered the line to 64% where it bottomed. This week's upturn shows the red line rising again. That's a good sign for the market. It may also be a good sign for the stocks that are testing or trying to regain their 200-day averages. The blue line at the bottom of Chart 5 shows the percent of NYSE stocks above their 50-day average. That more volatile line fell from 80% to 45% during the first quarter which is a relatively mild setback. And it appears to be climbing again as well. Also good for stocks.