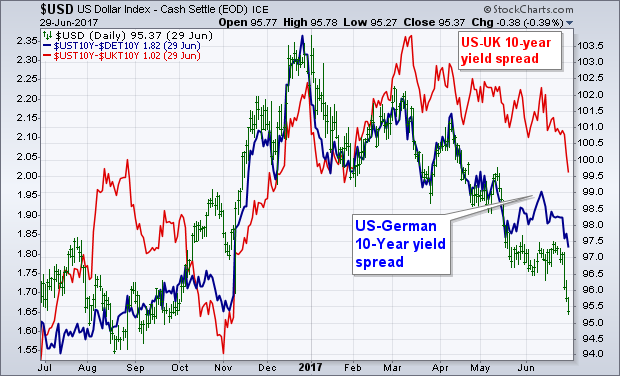
The U.S. Dollar has had a bad six months. And things got even worse this week. The driving force between currencies is the relationship between global interest rates. The 10-Year Treasury yield remains higher than foreign developed yields. The problem is that the difference between them is narrowing. The green bars in Chart 1 show the U.S. Dollar Index over the last year. The blue line plots the difference between the 10-Year Treasury yield and the 10-Year German Bund yield. After rising during the fourth quarter, they peaked together in December and have both fallen to the lowest level of the year. That reflects the fact that German yields are rising faster than Treasuries. That was especially true this week when the 10-Year German yield jumped 20 basis points (through Thursday) versus a 12 bps bump in Treasuries. That's good for the euro but bad for the dollar. The 10-Year UK Gilt yield jumped 22 basis points. The red line in Chart 1 shows the difference between Gilt and Treasury yields also narrowing. That boosted the British pound against the dollar. That suggests that dollar weakness is more a reflection of what's happening in foreign markets as foreign central bankers start moving toward normalization of interest rates. The fact that three bank chiefs in Europe, Britain, and Canada suggested that in the same week strongly hints at a coordinated plan to start lifting global rates. The Fed started that process in October 2014. Foreign bankers are just getting started. That means they have a lot of catching up to do. That's bad for the dollar.
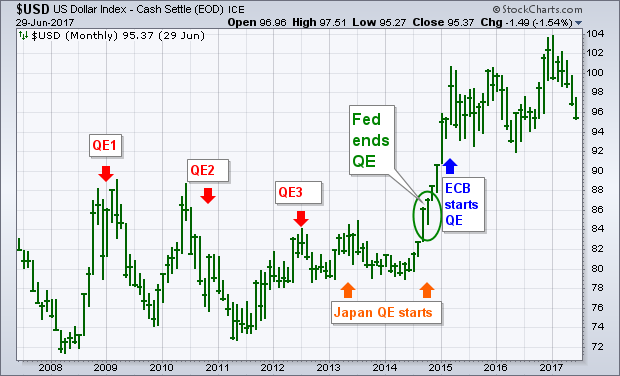
 The next chart show the impact that global QE programs have had on the dollar. And are likely to have now. The first three red arrows in Chart 2 show the three bouts of quantitative easing (QE) initiated by the Fed at the end of 2008, November 2010, and September 2012. With the Fed ahead of the rest of the world, those three moves kept the dollar down relative to foreign currencies. Japan started their own QE program in the spring of 2013 (start of Abenomics) and again in October 2014 (which weakened the yen). The Fed ended its QE program in October 2014 (green circle). That helped launch a bull run in the dollar. The ECB launched QE at the start of 2015. That helped boost the dollar against the euro. Since 2014, the dollar has benefited from the fact that foreign central bankers have been in an easing mode while we were starting to tighten. Judging from comments from foreign central bankers this week, and big jumps in foreign yields and currencies, it appears that the U.S. is now losing that yield advantage. That may be signalling a major peak for the dollar. But possibly a bottom in commodities.