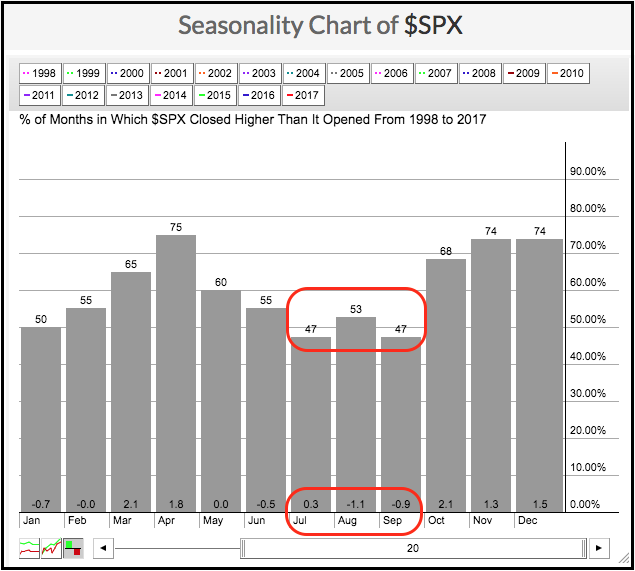
The chart below shows the seasonal tendency for the S&P 500 over the last twenty years (1998 to 2017). The number at the top of each bar shows the percentage of months the S&P 500 advanced for that particular month, while the number at the bottom shows the average gain/loss (percentage) for that month. For example, the S&P 500 rose 55% of the time in June and the average gain is actually a loss (-.5%).
These numbers further reveal that the next three-month stretch was the weakest three-month stretch over the last 20 years. First, the S&P 500 advanced less than 50% of the time in July and September (47% each). These are the only two months below 50%. The S&P 500 advanced just 53% of the time in August, which is the fourth lowest reading. Taken together, the average of the last three months is 49% ((47+53+47)/3=49) and this is the lowest of any three-month stretch.
The average gain/loss at the bottom of the chart reinforces the negative bias for the next three months. The average loss for the S&P 500 is -1.1% in August and -.90% in September. These are the two biggest negative numbers on the histogram. Further more, the sum of the last three months is the lowest of any three month period (+0.3% + -1.1% + -0.9% = -1.7%). History does not always repeat itself, but the historical tendency is clearly negative over the next three months. Might be a good time to go fishing!
Follow me on Twitter @arthurhill - Keep up with my 140 character commentaries.
****************************************
Thanks for tuning in and have a good day!
--Arthur Hill CMT
Plan your Trade and Trade your Plan
*****************************************


