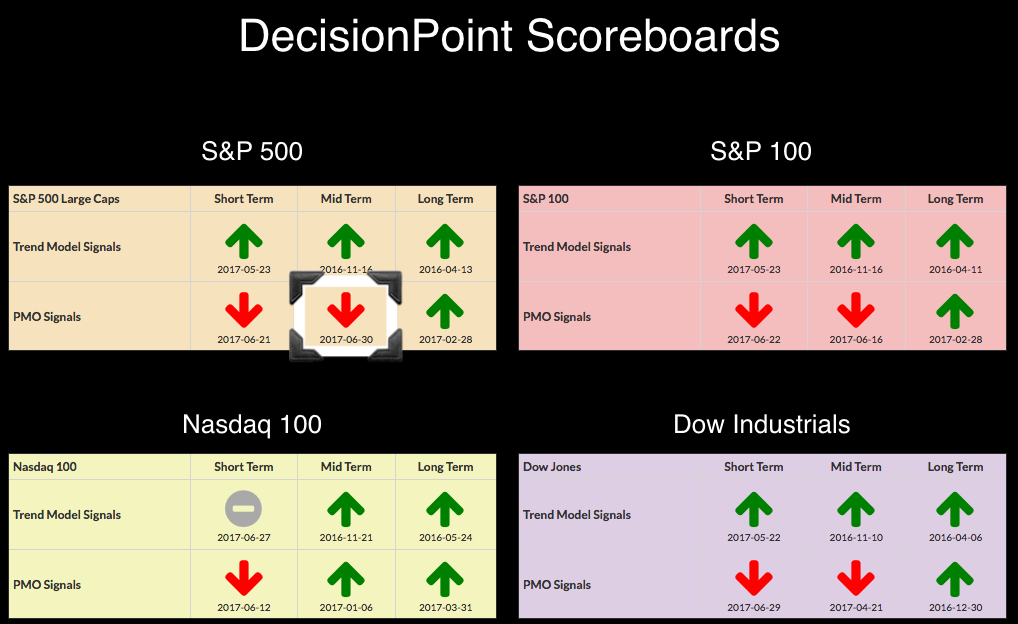
Price trends may be up, but momentum is clearly down in the in the short and intermediate terms. The NDX escaped a weekly PMO negative crossover SELL signal by only a small amount and that is because techs had a great run over the past month or so. FYI - LT PMOs are still rising nicely on the monthly charts so the long term still . To see daily, weekly and monthly charts annotated for these four indexes, go to the DecisionPoint ChartList. The link is at the top of the DecisionPoint blog.
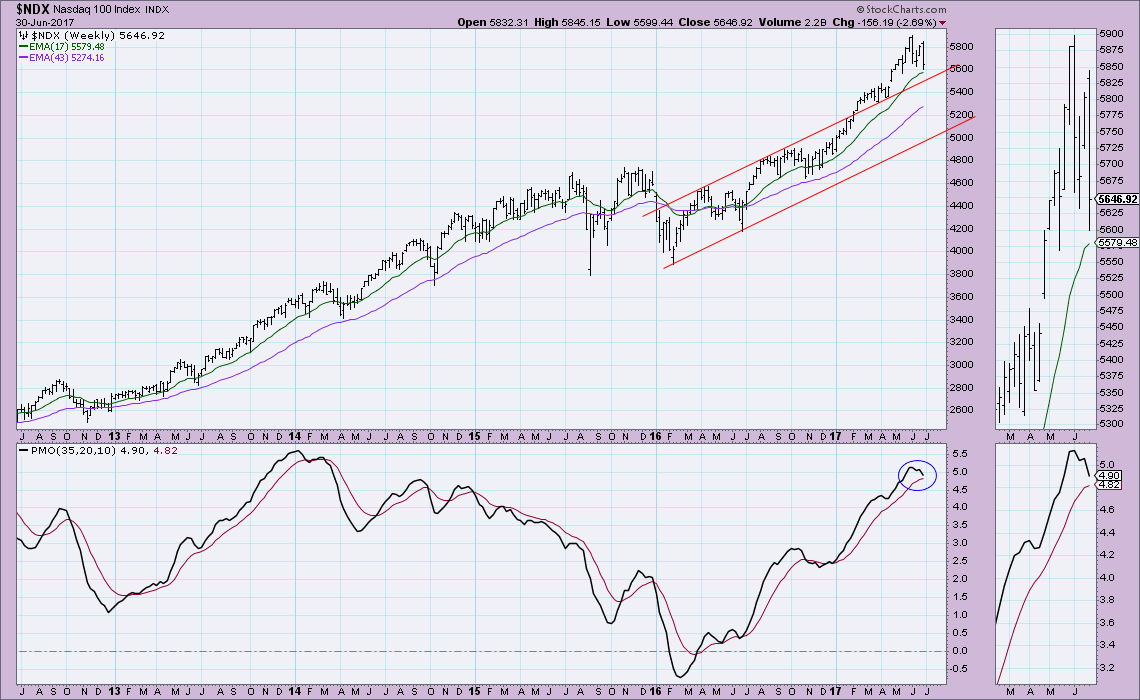
The NDX didn't miss a PMO SELL signal by much on the weekly chart below. Price seems destined to at least test the top of the rising trend channel around 5550. Techs had been the favored son, but the last 3 weeks showed price failing to even test all-time highs so I would expect a PMO SELL signal soon. If we see it, it will arrive in overbought territory which I find especially bearish.
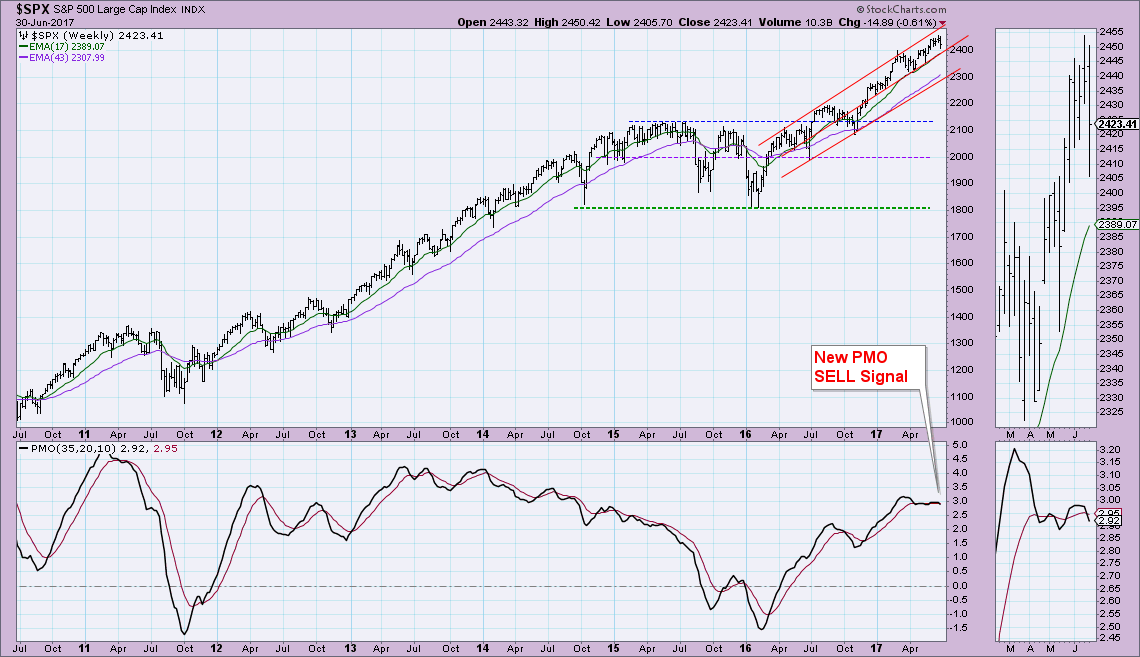
I've annotated the new IT PMO SELL signal on the SPX weekly chart below. The PMO has been indecisive, traveling mostly sideways. This has been a problem as far as whipsaw signals. We're not out of the woods for another whipsaw, but having looked at DecisionPoint IT indicators (Check the DecisionPoint blog to see indicator analysis), I think we are going to see a drop to support just below 2400 along the rising bottoms trendline at a minimum (we're almost there) and worst case, I'd be looking at a test of the April low at 2300 which likely will coincide with rising bottoms support drawn from mid-2016.
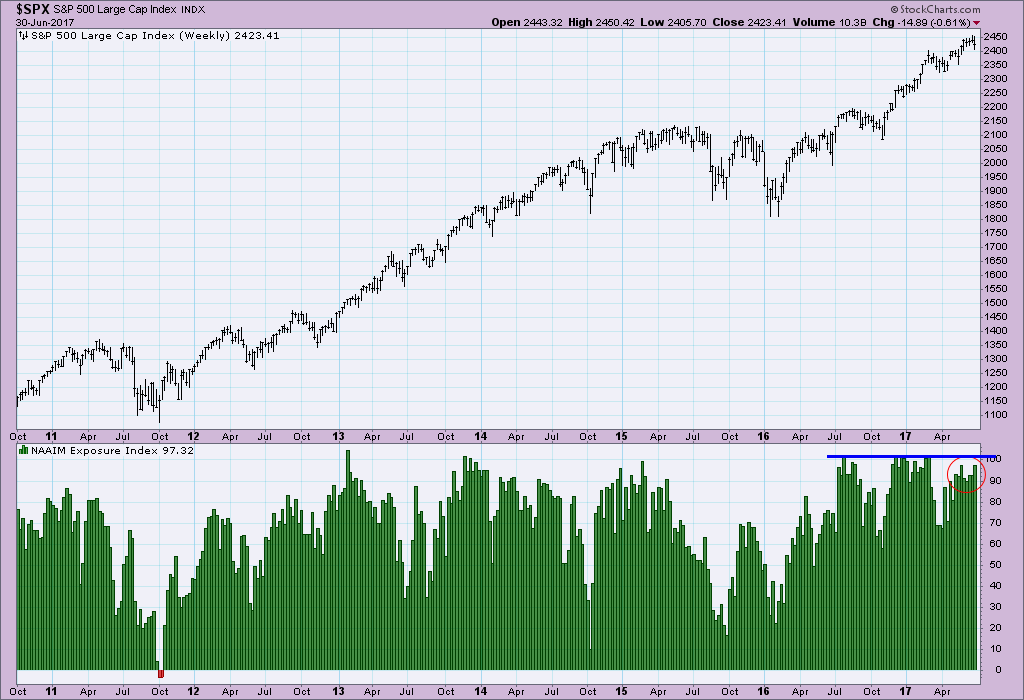
While we could see prices move lower than 2300, I'm not that bearish right now and apparently neither are the members of the National Association of Active Investment Managers (NAAIM). When I reviewed this sentiment chart during MarketWatchers LIVE this morning, I pointed out that NAAIM is reporting higher exposure this week. Yet, they do seem to be exercising some caution as they are not as exposed as we've seen them previously.
Conclusion: Momentum has slowed in the major indexes in both the short and intermediate terms. The NDX may not have generated an IT PMO SELL signal, but a look at the chart and knowing tech is suffering tells us that a SELL signal is not that far away. Given the bearishness of weekly momentum, I'm expecting more downside to test support at 2300 for the SPX.
Helpful DecisionPoint Links:
DecisionPoint Shared ChartList and DecisionPoint Chart Gallery
Price Momentum Oscillator (PMO)
Swenlin Trading Oscillators (STO-B and STO-V)
Technical Analysis is a windsock, not a crystal ball.
Happy Charting!
- Erin
**Don't miss DecisionPoint Commentary! Add your email below to be notified of new updates"**


