
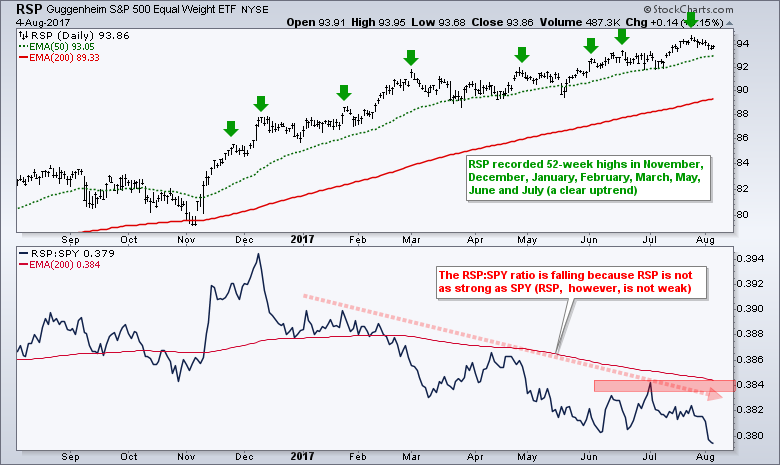
The price relative, or ratio chart, is handy for measuring relative performance, but it does not always reflect the trend for the underlying securities. For those unfamiliar, the RSP:SPY ratio measures the performance of the EW S&P 500 ETF (RSP) relative to the S&P 500 SPDR (SPY). RSP leads when this ratio rises because the numerator (RSP) is increasing faster than the denominator (SPY). RSP is lagging when the ratio declines.
Let's first look at a price chart and analyze the overall trend. The chart below shows the EW S&P 500 ETF in the top window and the RSP:SPY ratio in the lower window. Price-wise, RSP is in a clear uptrend with a string of 52-week highs from November to July. The 50-day EMA is well above the 200-day EMA and there is nothing but uptrend on this chart. As the name implies, the components in the S&P 500 Equal-Weight ETF are equally weighted and this ETF represents the "average" stock in the S&P 500. 52-week highs in RSP reflect broad participation. Sure, there are some pockets of weakness within the index, but participation is clearly broad enough to keep the EW S&P 500 ETF in an uptrend. Even though RSP is in a clear, and strong, uptrend, the price relative is in a downtrend and hit a new low this past week.
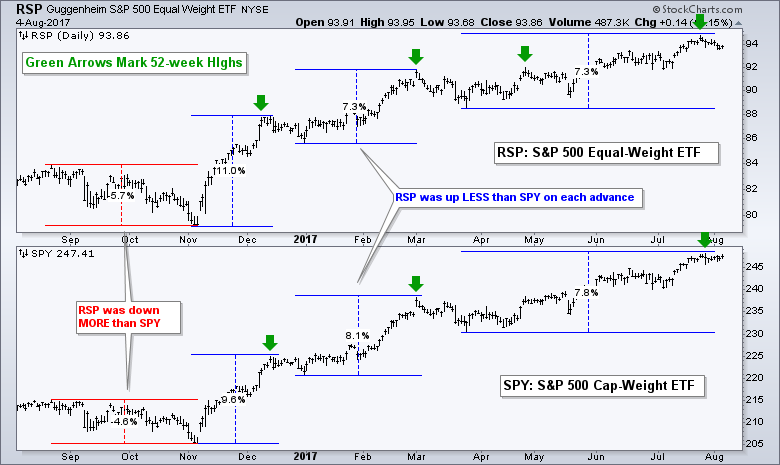
Why exactly is the RSP:SPY ratio so weak? Let's compare the charts for RSP and SPY to find out. The chart below shows RSP and SPY with the percentage change tool measuring recent price moves. RSP lost more than SPY on the first decline and then gained less than SPY on the three subsequent advances. The differences, however, are relatively small. Overall, RSP is up 14.46% over the past year and SPY is up 16.65%. SPY is up more and leading, but RSP is not exactly a slacker! More importantly, notice that RSP confirmed the new highs in SPY throughout the year (green arrows). This tells me that RSP is keeping pace on the price chart and this is bullish for the broader market. The trouble starts when/if RSP does not confirm a new high in SPY and the price charts start to diverge.
Follow me on Twitter @arthurhill - Keep up with my 140 character commentaries.
****************************************
Thanks for tuning in and have a good day!
--Arthur Hill CMT
Plan your Trade and Trade your Plan
*****************************************


