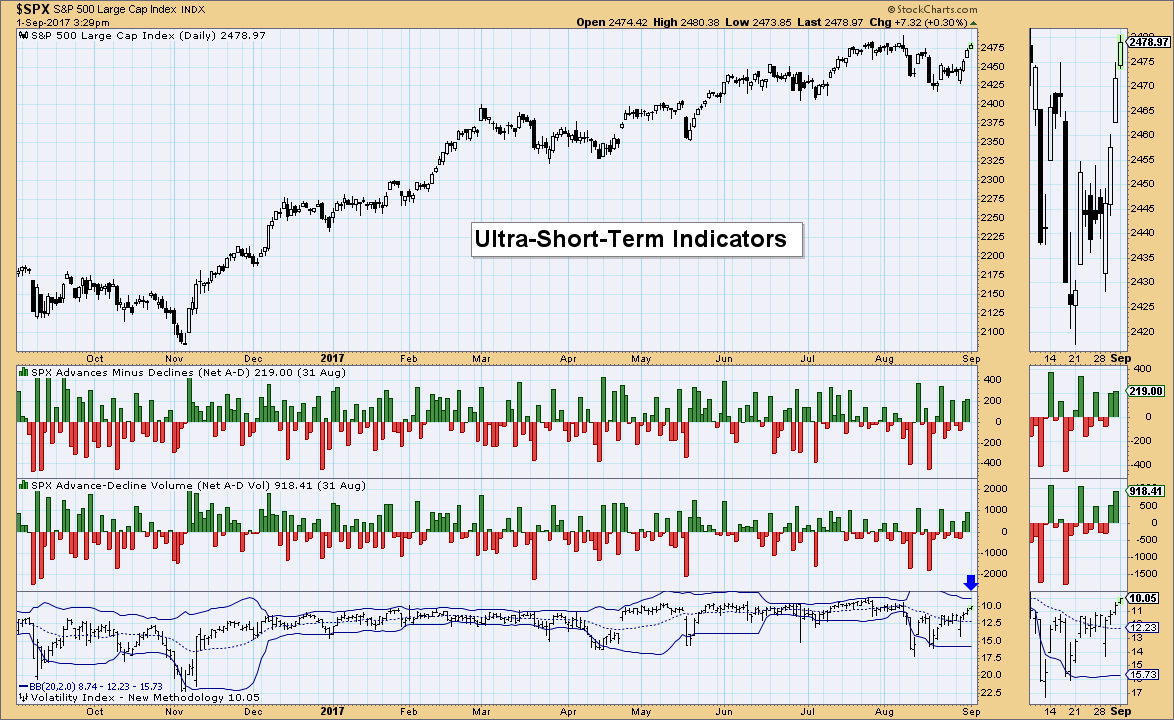
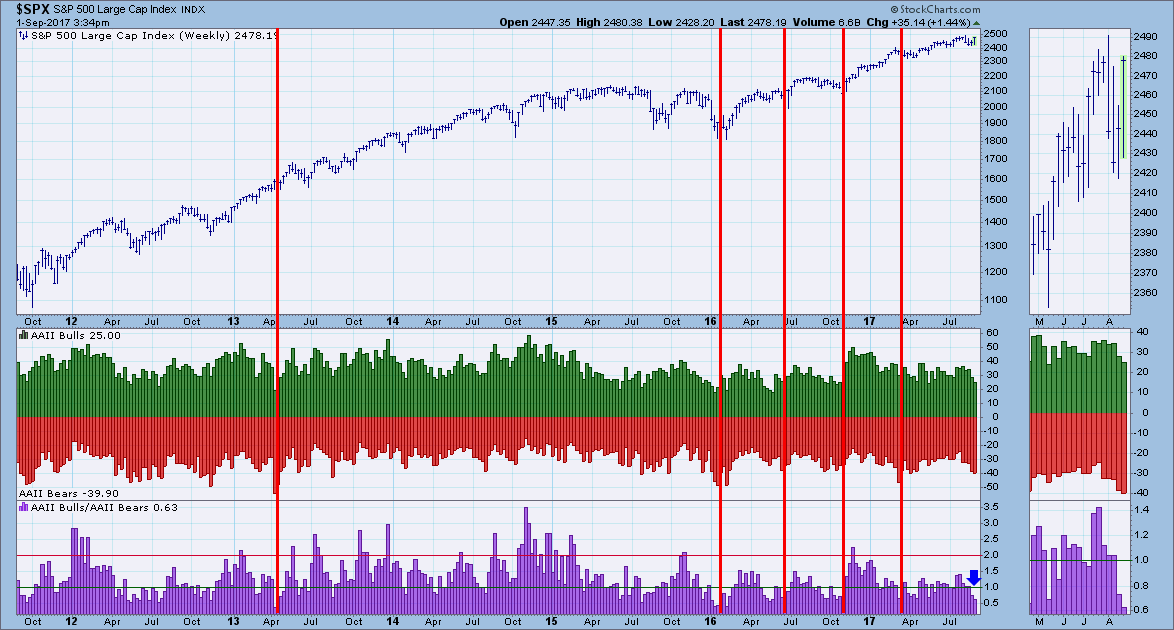
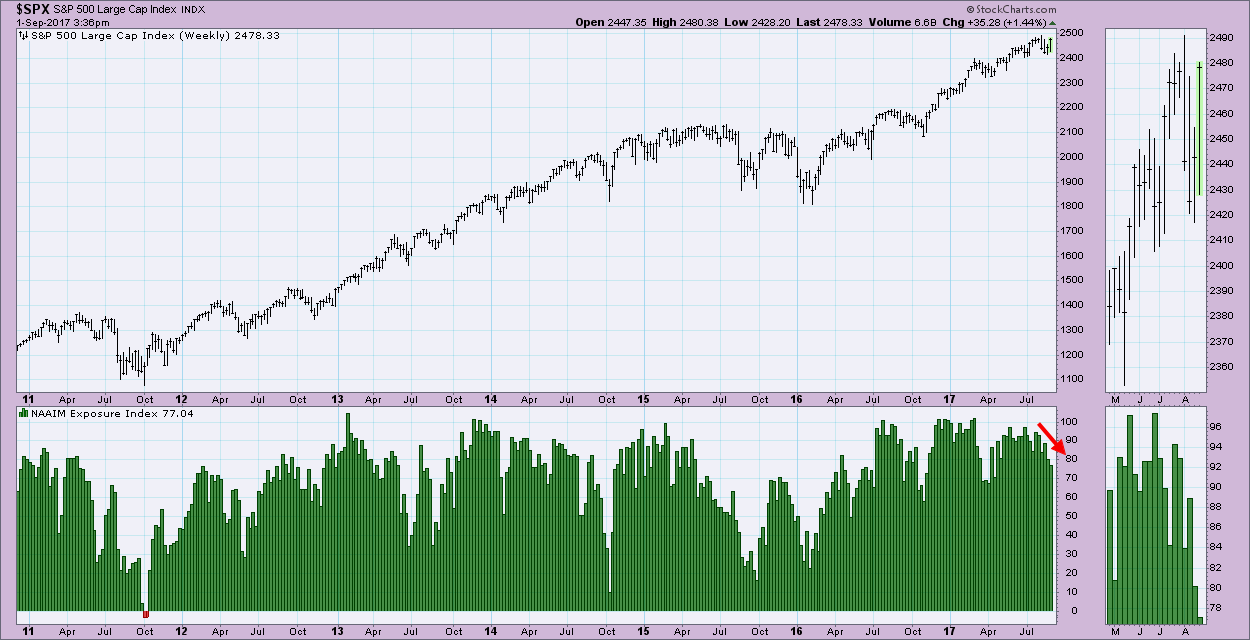
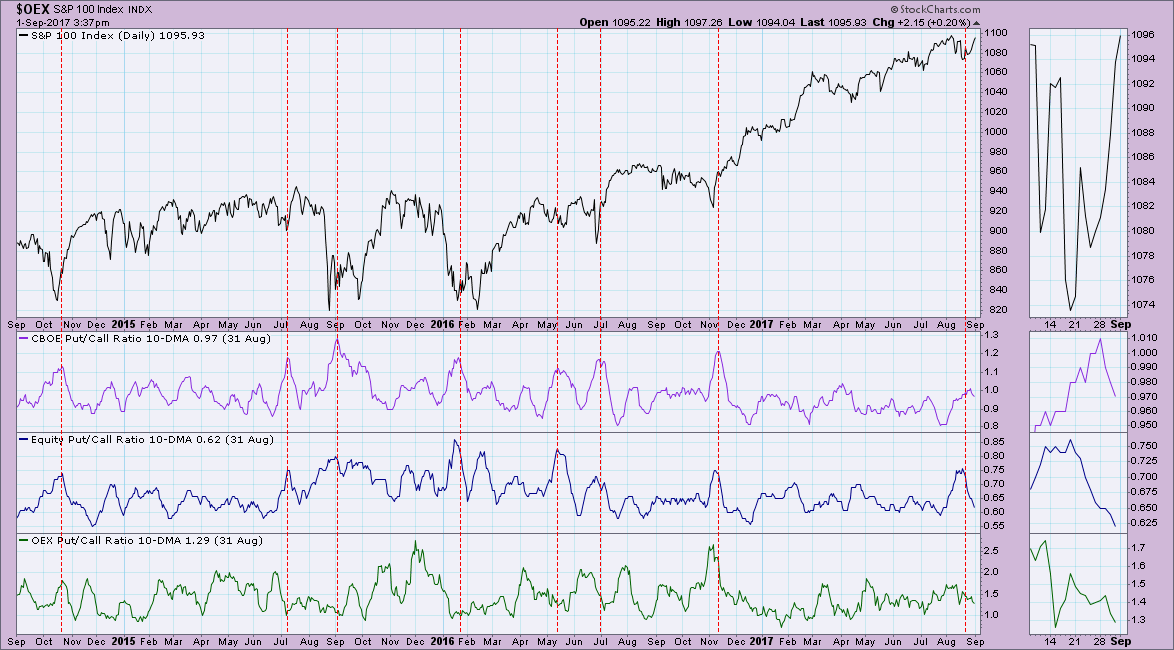
 As I prepared for the MarketWatchers LIVE segment on sentiment today, I was surprised to see investors and money managers are getting very bearish. Put/Call ratios show a bearish bias as well. It is important to remember that sentiment is a "contrarian" indicator. It works a bit like the VIX which more of you may be familiar with. When the VIX begins showing climactically higher readings, that is bullish; while climactically lower readings are bearish.
Interestingly, the VIX is moving to lower and lower readings and in the chart below you can see readings are about ready to puncture the upper Bollinger Band (I use an inverted scale because if I see "overbought" readings, that typically is bearish and vice versa). With lower readings persisting right now, this can be considered bearish in the very short term. I believe the VIX is a great barometer for the very short term (hours to days). Given this reading, I'm expecting the market to close lower next week. You'll also note there were climactic readings as far as bullish breadth. I'd also look at this a bearish.
Let's look at the longer-term sentiment indicators. You'll see on AAII, the bull/bear ratio is very low. This means there is a preponderance of bears. Remember sentiment is contrarian so this is bullish in the medium term. Notice when the bull/bear ratio hits oversold/low readings. You could click on this chart and annotate many other times when this indicator has been on top of market rallies.
The National Association of Active Investment Managers (NAAIM) shows that money managers are limiting their exposure. We're reaching readings where we've seen price bottoms in the market.
Finally, take a look at the Put/Call ratio chart. You'll note that peaks on CBOE and Equity ratios typically result in market rallies.
Conclusion: The very short term is looking bearish. The market seems prepared for a pullback next week based on VIX and breadth numbers. However in the longer term, the Put/Call ratio, AAII and NAAIM sentiment suggests a price bottom in the market at the ready.
Helpful DecisionPoint Links:
DecisionPoint Shared ChartList and DecisionPoint Chart Gallery
Price Momentum Oscillator (PMO)
Swenlin Trading Oscillators (STO-B and STO-V)
Technical Analysis is a windsock, not a crystal ball.
Happy Charting!
- Erin
**Don't miss DecisionPoint Commentary! Add your email below to be notified of new updates"**


