I get it. Energy has been the worst sector for the last 8 months. Everything is ugly. So is there absolutely no hope? There are some wonderful clues on the charts that this might start to heat up. Not just on Hurricane Harvey, but the charts were starting to get interesting in July. Now on September 1, they are very interesting!
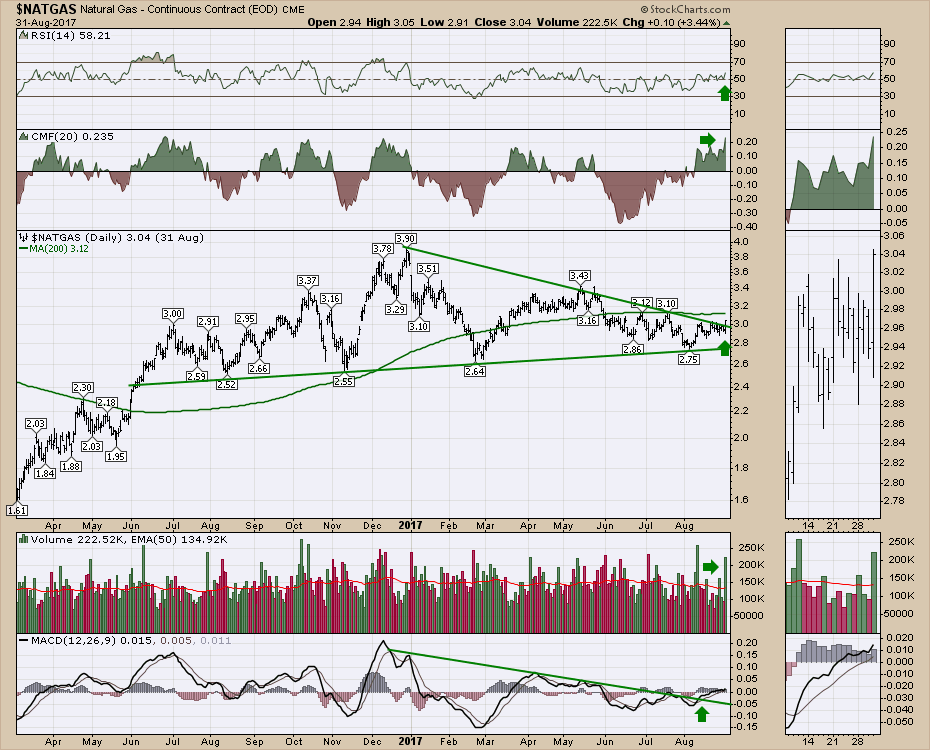
Natural Gas ($NATGAS) looks really good here to me.
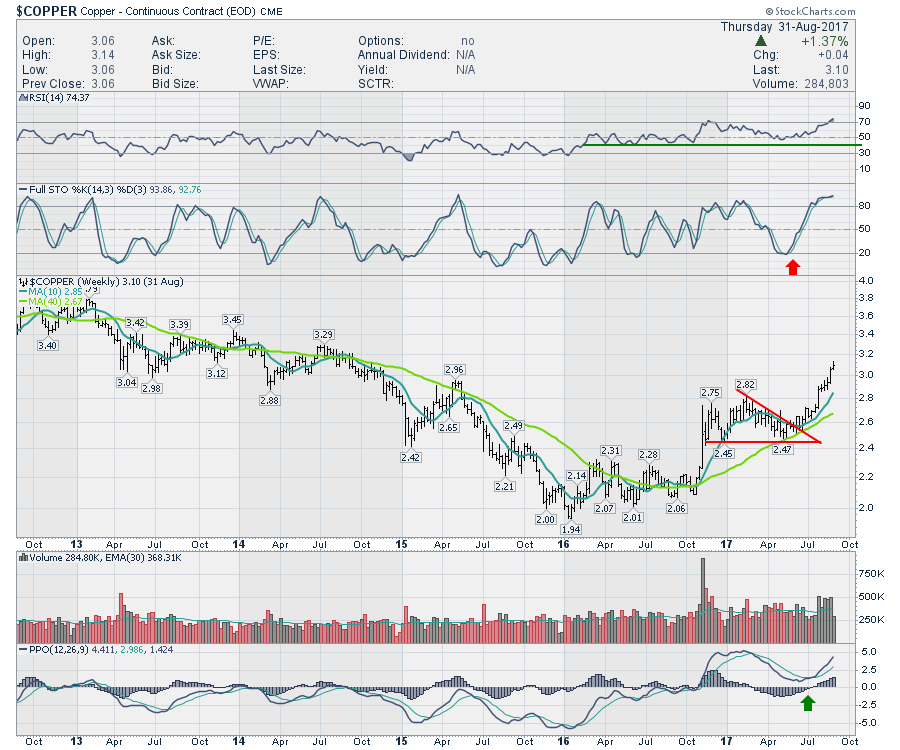
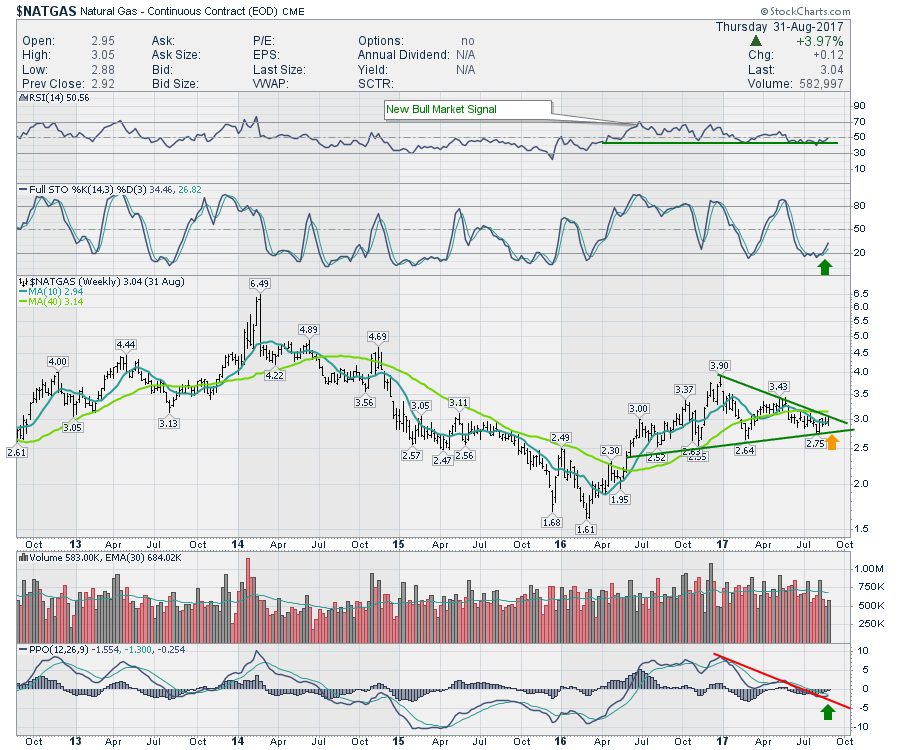
On a weekly chart it looks even better! The PPO turning up from just under zero gives lots of room to the upside. The RSI has held 40 which is associated with a bull market. The Full Stochastics suggest it is time to get on board. The price is breaking out of a consolidation after getting the bull market signal on the RSI, which looks very similar to Copper a while back.
 I discussed all of this and much, much more if you are interested in the energy trade on the Commodities Countdown 2017-09-01. You can watch that Video here. I recommend clicking the HD button for better clarity.
Commodities Countdown Video With Greg Schnell 2017-08-31 from StockCharts.com on Vimeo.
Lastly, my good friend Tom Bowley and I will be hosting the StockCharts Market Outlook on Saturday September 9th at 11:00 AM EDT. Click to register in advance and set a reminder in your calendar. It should be a great event!
Good trading,
Greg Schnell, CMT, MFTA


