I've been expecting a new PMO BUY signal on both the SPX and the OEX. The OEX managed to wrangle the PMO above its signal line, but the SPX is struggling to garner its PMO BUY signal. Big news on Oil! We just got a new Long-Term Trend Model BUY signal which technically means there is a bull market bias in the long term for USO.
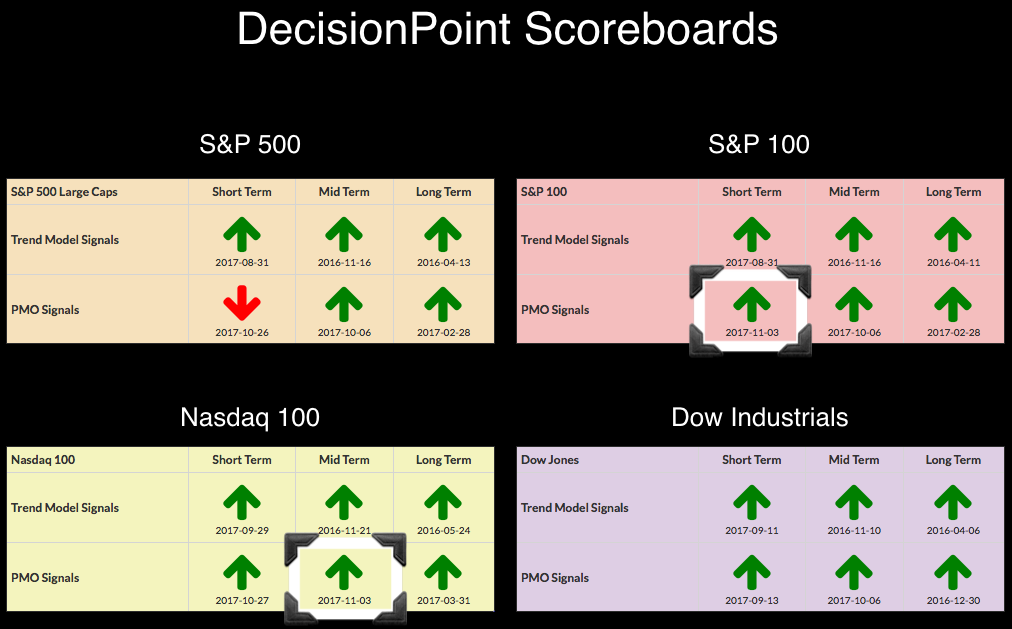
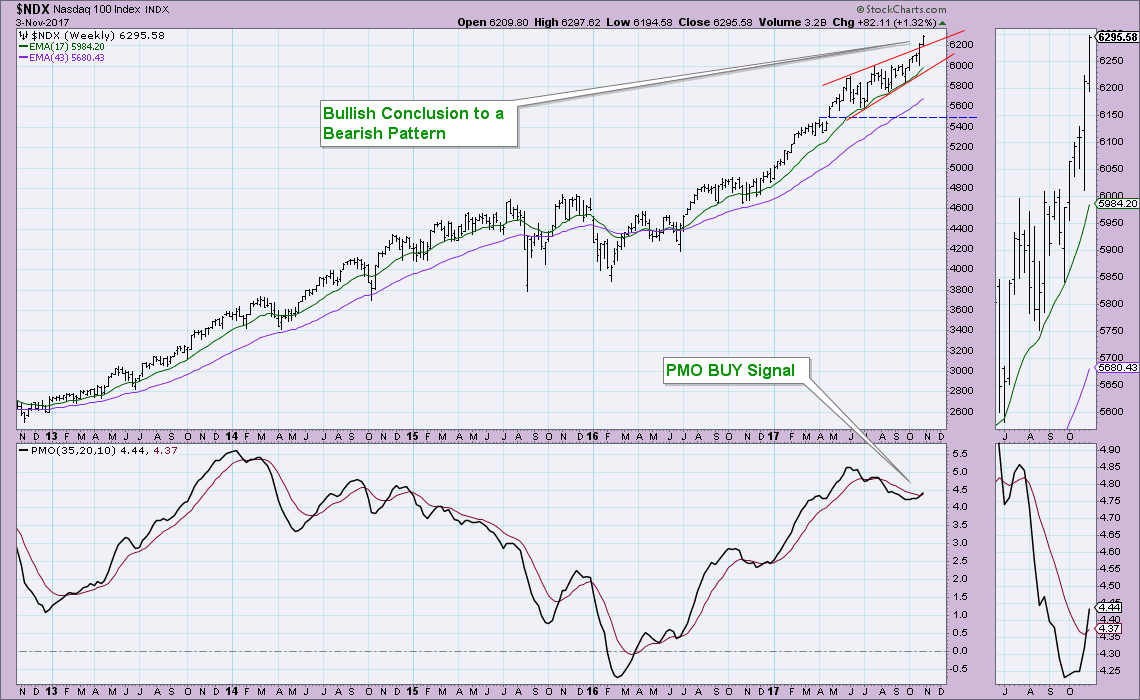
Let's start with the NDX which produced (finally!) an intermediate-term PMO BUY signal. The intermediate-term PMO signals are taken from the PMO behavior on the weekly chart. As you can see below, the tech-heavy NDX saw a positive PMO crossover. I always love to see a bullish conclusion to a bearish pattern. I find these breakouts especially bullish.
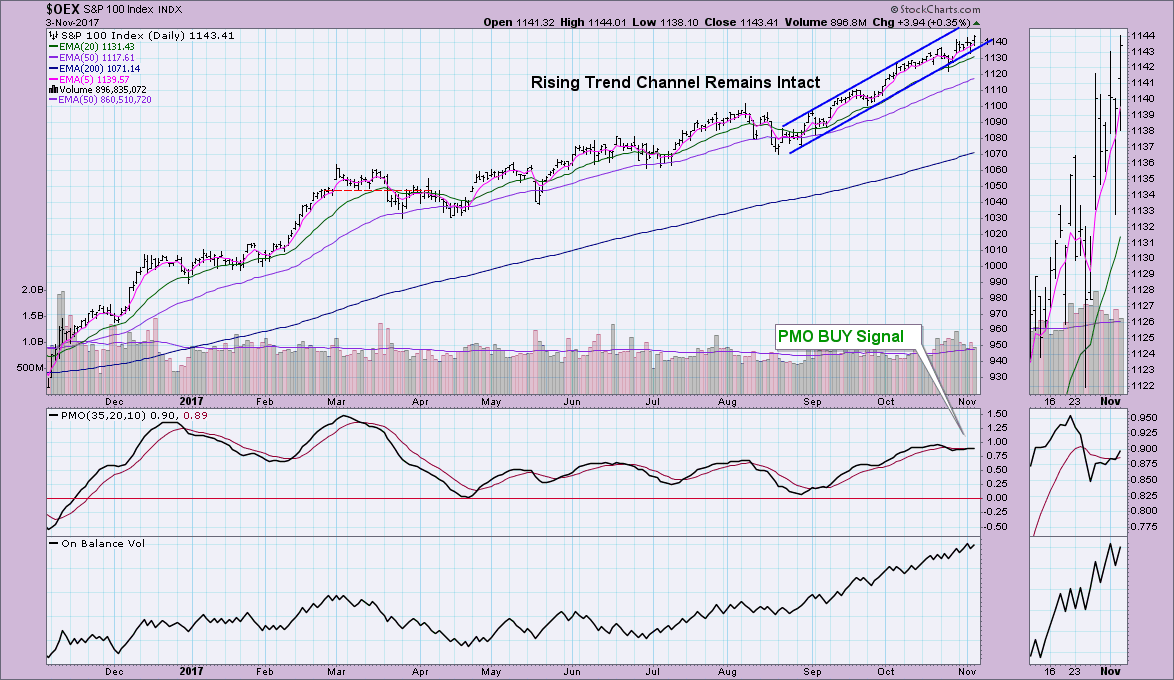
On the OEX we can see that the PMO turned itself around, but it has taken its time to reach a positive crossover. The chart looks bullish. We have a rising trend channel that is intact and the EMAs are configured very positively; not only are the fastest EMAs on top, but the margin between them is plentiful. The OBV is rising nicely.
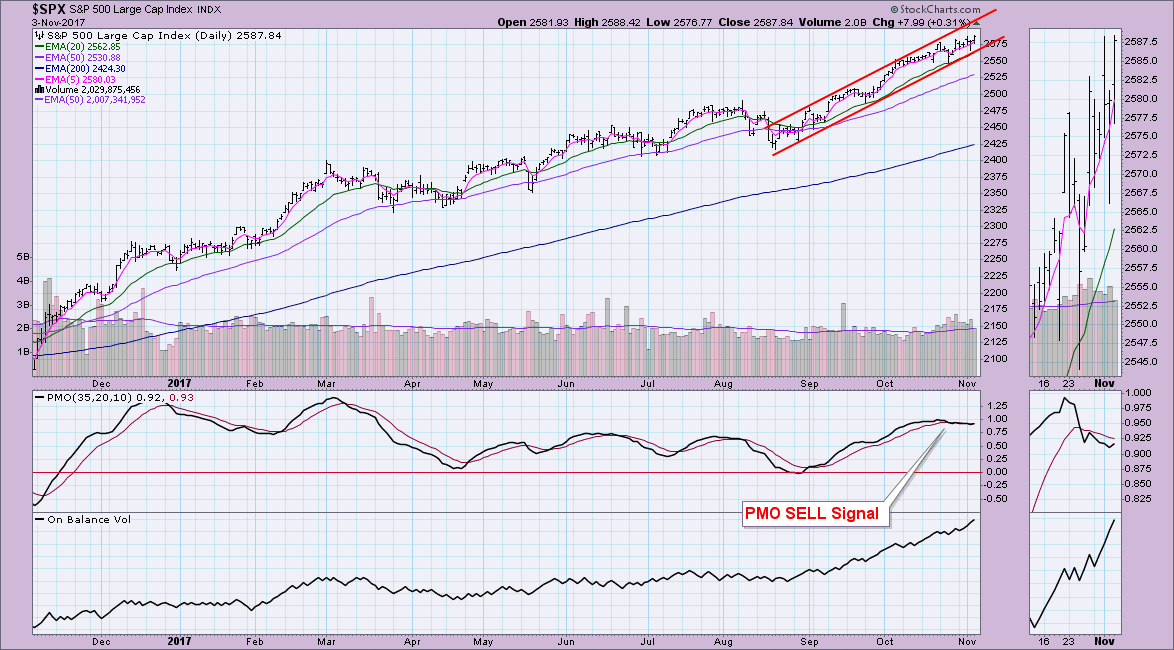
When you look at the DecisionPoint Scoreboards, the bull market is in full force. However, the one flaw is the SPX PMO SELL signal. As you can see, the PMO is reacting similarly to the OEX's PMO, it simply hasn't managed enough positive momentum to push the PMO up and over its signal line. Like the OEX, we have an intact rising trend channel. It's hard to be bearish about the markets right now.
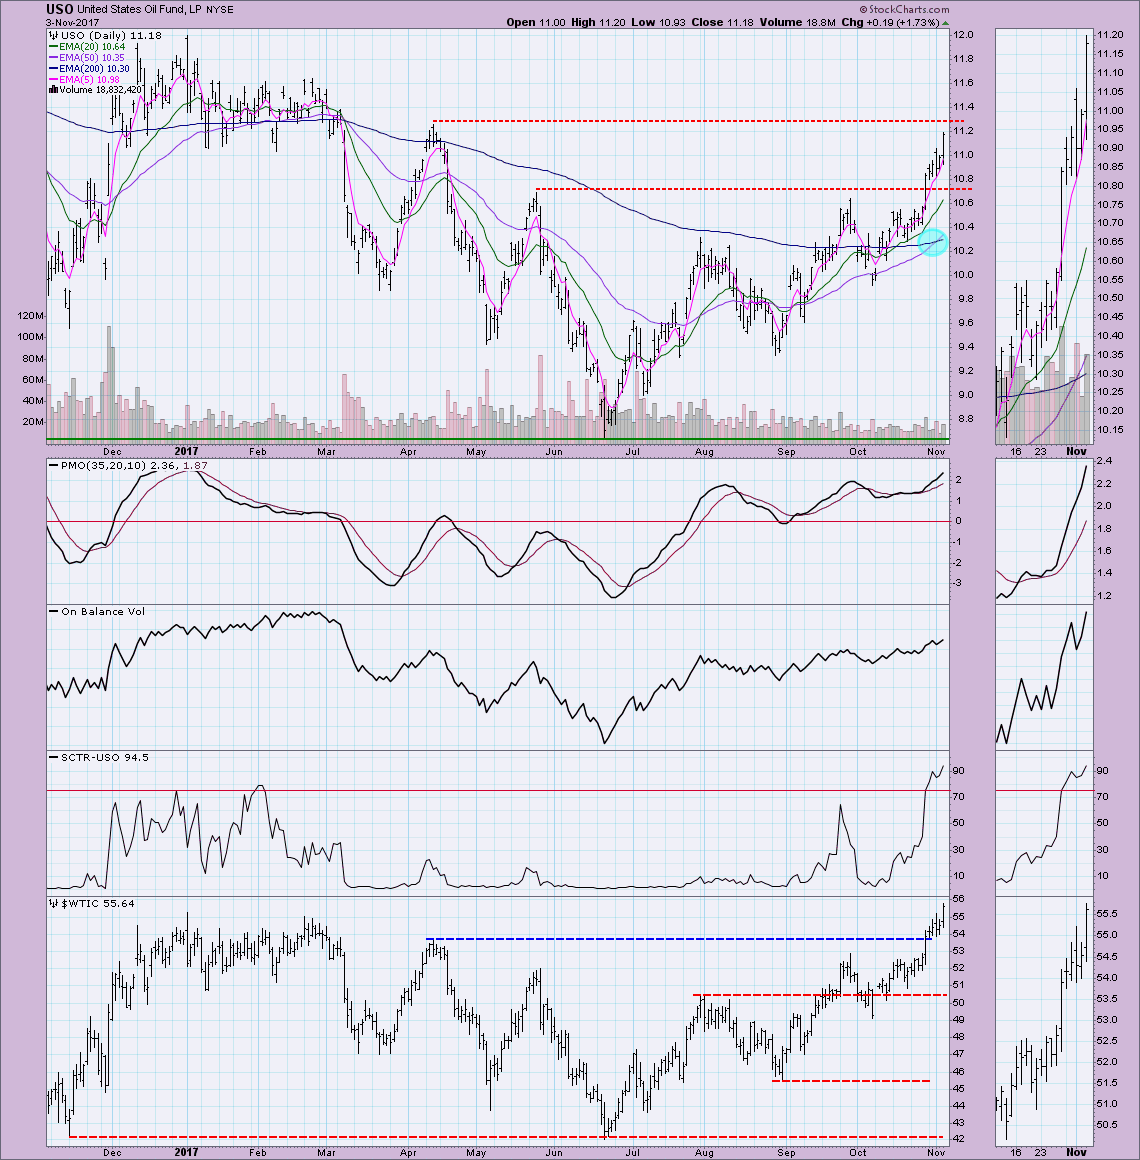
Oil also had a windfall today with a new Long-Term Trend Model BUY signal. The signal actually triggered yesterday, but I wanted to share the chart. A LTTM BUY signal is created when the 50-EMA crosses above the 200-EMA. My one concern with USO is that overhead resistance is nearing. However, with such positive indicators (the SCTR is now in the hot zone, OBV rising) I'm not overly worried. The PMO is now fairly overbought along with price which could be a problem, but it sure doesn't look like it is ready to top. Notice also that Oil has now closed above $55/barrel, that is a new high for the year.
Helpful DecisionPoint Links:
DecisionPoint Shared ChartList and DecisionPoint Chart Gallery
Price Momentum Oscillator (PMO)
Swenlin Trading Oscillators (STO-B and STO-V)
Technical Analysis is a windsock, not a crystal ball.
Happy Charting!
- Erin
**Don't miss DecisionPoint Commentary! Add your email below to be notified of new updates"**

