Oil trades have had a big beautiful run from June into early January. The commodity related stocks have also run since August. But there are some relative strength relationships we need to see break out to launch the next phase of stock runs.
Within the energy space, the recent flare-up in Natural Gas prices appeared as NYMEX traders felt the cold come in. Oil has been a persistent bull and just keeps adding a new high every week. But the energy exploration stocks and the oil service stocks had not broken out of their big down trends in relative strength (RS) during 2017. Perhaps that can change in 2018.
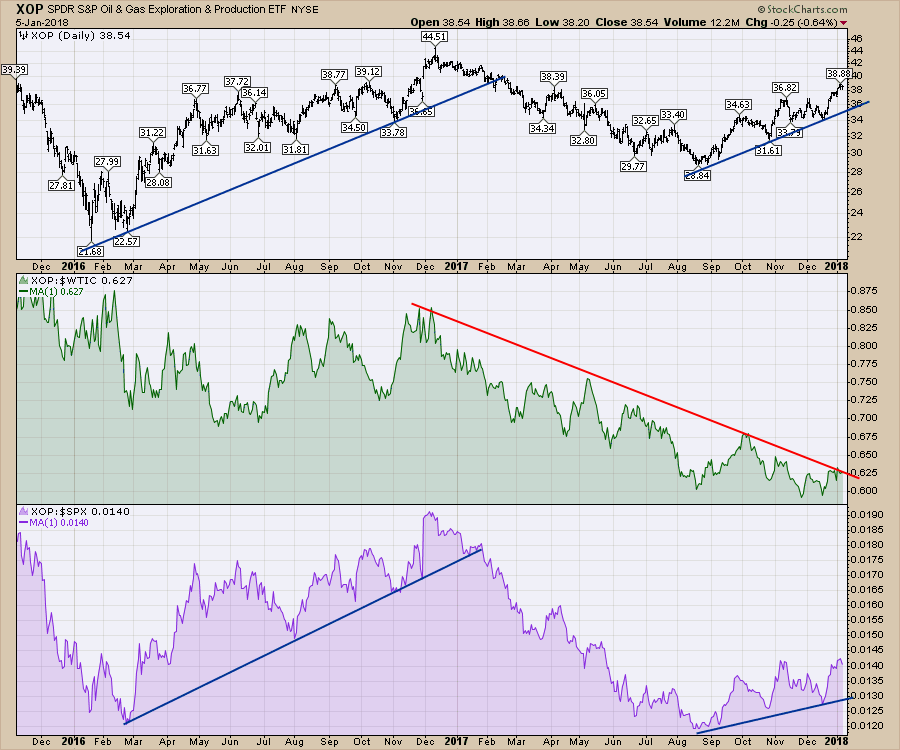
In the first chart, the Exploration and Production ETF XOP chart compared to oil and the S&P 500 shown in purple denote the problem. While the XOP does not have to outperform oil, it needs to at least keep up with oil to change the trend. As long as XOP is outperforming the $SPX, everyone seems happy with the rising trend. The $SPX relative strength surged to new 7-month highs this week. The big signal will come when XOP can start to outperform on both.
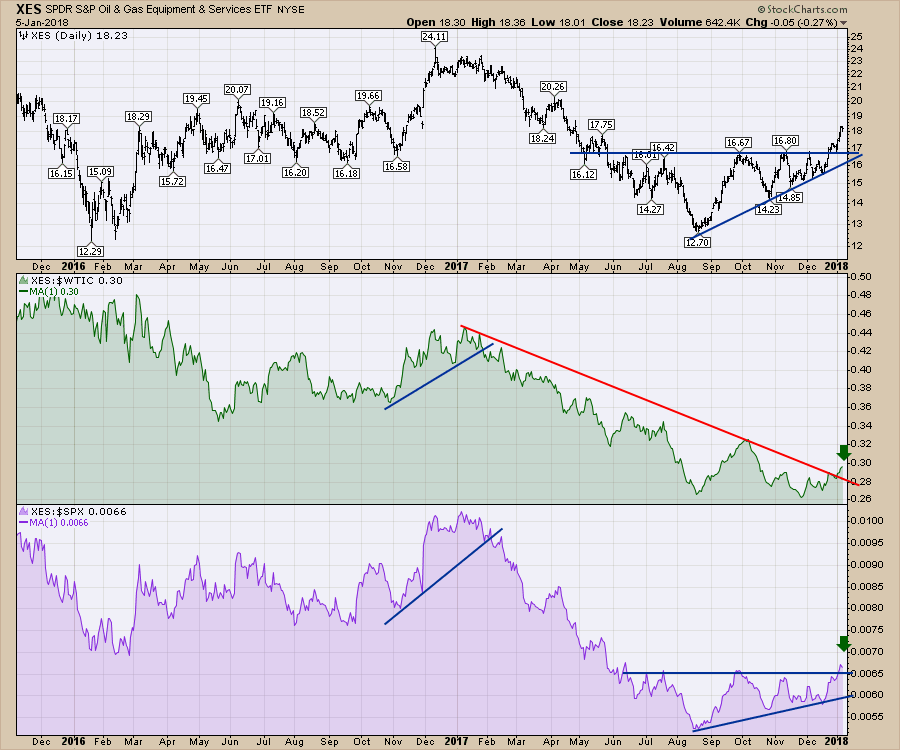
The oil services ETF XES is in a similar place. But there is a spark of enthusiasm. In 2018, XES started to break out in relative strength to the price of oil. It also started to make new 8-month highs in relative strength compared to the $SPX as we enter 2018. When RS is accelerating on both relative strength indicators, it can be very bullish.
While I have been steadfast in my bullish bias for higher oil and higher oil stock prices, it has been a grind. We are starting to see the signs that may rapidly attract more money. That sign we are watching for is relative outperformance. You can click on these charts to get an update at any time in the future.
For more information on Commodity related ideas including gold and silver, check out the Commodities Countdown recording. It is usually posted on Thursdays and contains a vast array of information. Commodities Countdown 2018-01-04. If you like to investigate Canadian stocks, you might find the Canadian Technician recording helpful. Follow this link to the kickoff of 2018 recording. The Canadian Technician Recording 2018-01-02.
Good trading,
Greg Schnell, CMT, MFTA.


