Editor's Note: This article was originally published in John Murphy's Market Message on Friday, January 18th at 11:01am ET.
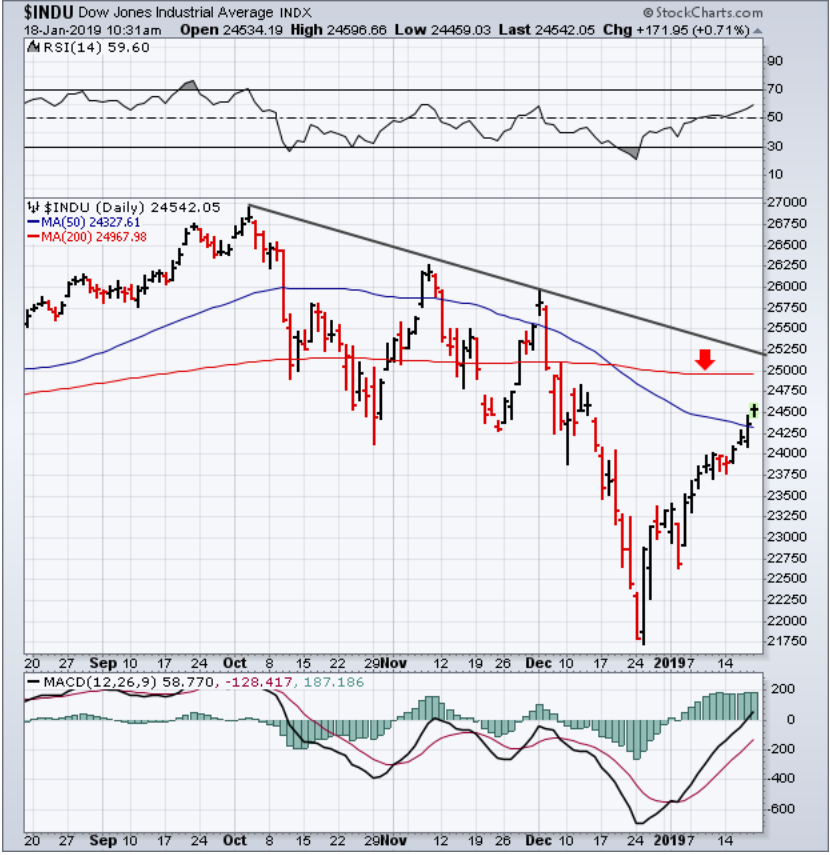
All major U.S. stock indexes have exceeded their 50-day averages (blue lines). That still leaves their 200-day averages to contain the rally. But there are a couple of other resistance lines that still need to be tested. Chart 1 shows the Dow Industrials nearing a test of their 200-day average (red arrow). In addition, the falling trendline drawn over its October/December highs should also provided stiff overhead resistance. The Dow would have to clear both barriers to signal a major turn to the upside. The same is true of the other two major stock indexes.
Chart 1

About the author:
John Murphy is the Chief Technical Analyst at StockCharts.com, a renowned author in the investment field and a former technical analyst for CNBC, and is considered the father of inter-market technical analysis. With over 40 years of market experience, he is the author of numerous popular works including “Technical Analysis of the Financial Markets” and “Trading with Intermarket Analysis”. Before joining StockCharts, John was the technical analyst for CNBC-TV for seven years on the popular show Tech Talk, and has authored three best-selling books on the subject:
Technical Analysis of the Financial Markets,
Trading with Intermarket Analysis and
The Visual Investor.
Learn More


