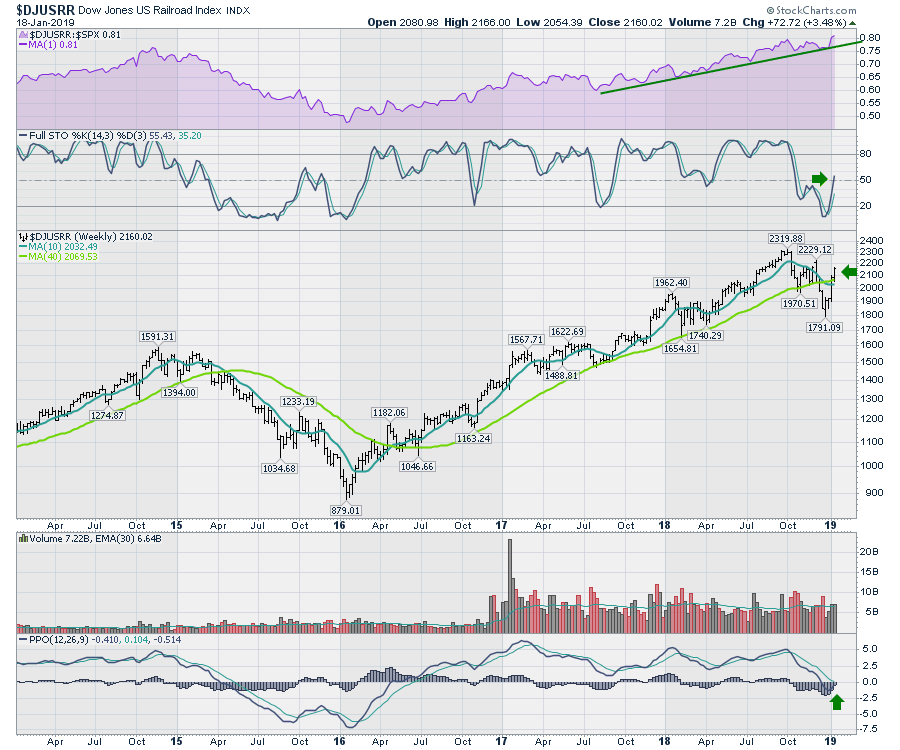
Railroads are back in an uptrend after the fourth-quarter correction. I like to keep track of the railroads and their relative strength compared to the $SPX. Most recently, the relative strength panel pulled down to the trend line and bounced off again; a nice bullish setup.
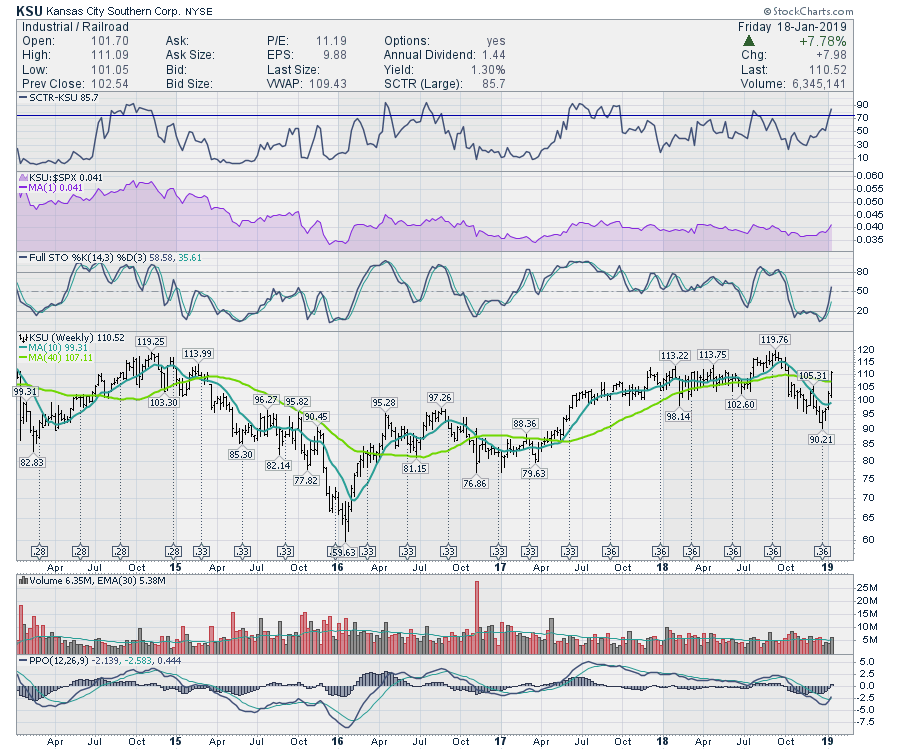
 Moving to the individual railroads, Kansas City Southern had a monster week. Price soared almost 8%! This follows an already big week last week. Since the December lows, the stock has gone up a massive 22%. The SCTR shows that KSU is moving into the top quadrant for price performance. SCTRS are like a sports ranking system, keeping track of which stocks have the fastest price momentum, and KSU is clearly surging.
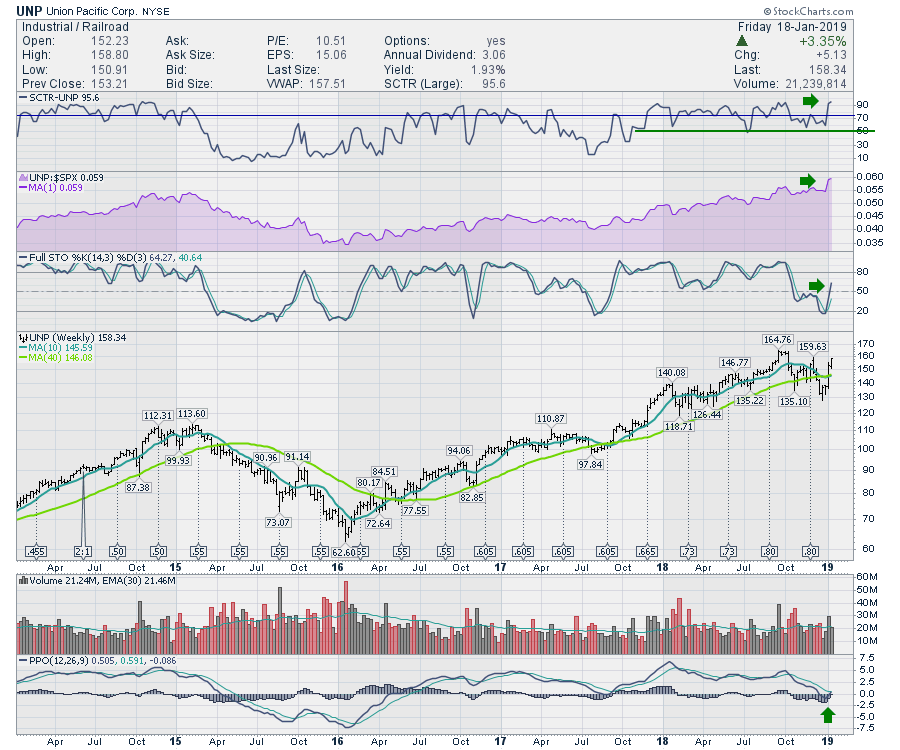
 Union Pacific is also doing well. The stock is very close to new 52-week highs and its SCTR ranking shows it behaving stronger than 95% of the large-cap stocks. The relative strength is hitting a new high! That is extremely bullish. The full stochastic is moving above 50, which is very bullish. The PPO turning up right at zero is a very solid signal.
 Other railroad charts are improving as well. Both CNI and CP are pushing higher quickly. I like the industry group here.
I had two shows this week for Market Buzz on StockCharts TV. There have been some beautiful sector setups to talk about recently. This new show is dedicated to weekly timeframe investing. Please follow me on Twitter and subscribe to my blog for regular updates.
There are some Canadian charts that look outstanding! This is my Canadian Market Review this week.
A lot of charts are changing this week. If you are looking for some positive areas of the market to investigate, I would strongly encourage you to look at my Weekend Market Roundup that you can find on The Canadian Technician articles. Follow this link to The Canadian Technician and don't forget to subscribe.
If you would like to learn more about the basics of charting, check out Stock Charts for Dummies. The first section of the book walks through all the chart settings to get the charts you want, the second section explores why you might use charts for investing and the third section is about putting it all together.
Click here to buy your copy of Stock Charts For Dummies today!
If you are missing intermarket signals in the market, follow me on Twitter and check out my Vimeo Channel. Bookmark it for easy access!
Good trading,
Greg Schnell, CMT, MFTA
Senior Technical Analyst, StockCharts.com
Author, Stock Charts for Dummies
Hey, have you followed Greg on Twitter? Click the bird in the box below!
Want to read more from Greg? Be sure to follow his StockCharts blog:
The Canadian Technician


