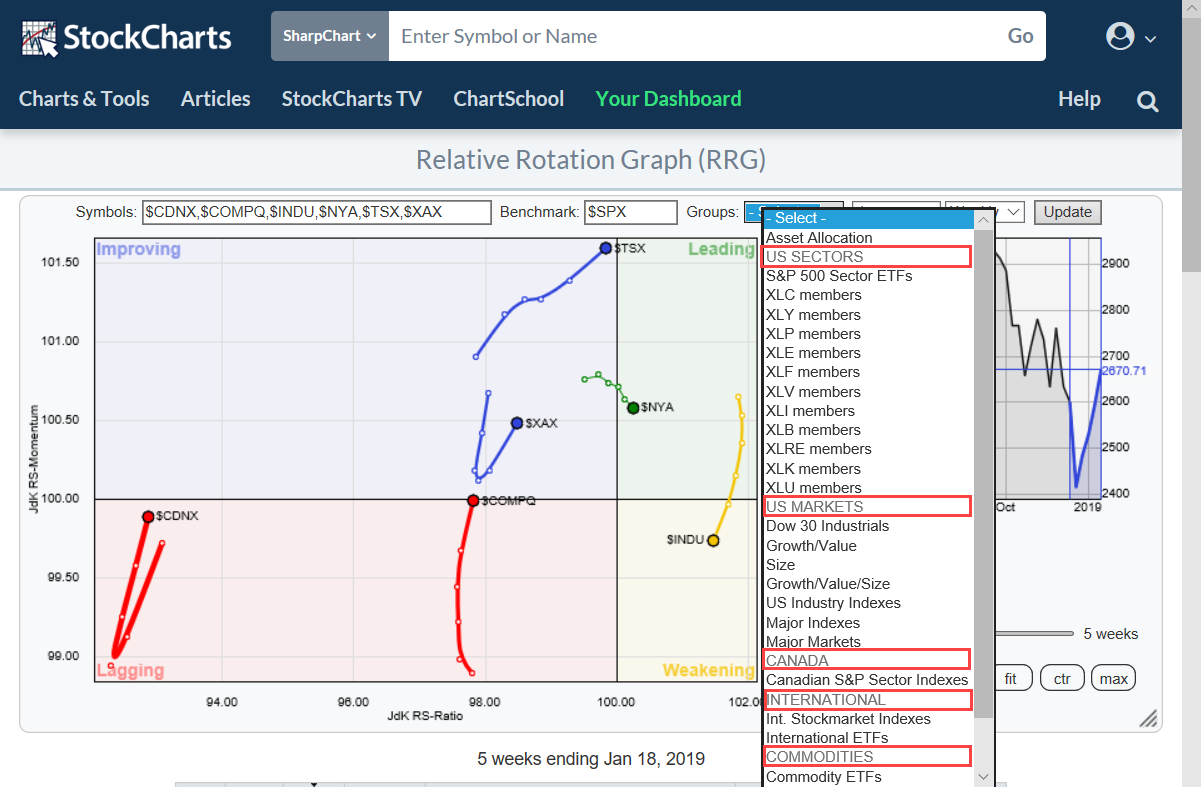
 If you are a regular user of Relative Rotation Graphs you are probably aware of the pre-defined groups (universes) that you can choose from when you open the drop-down box at the top op the chart.
In order to make life easier (for our users) and provide structure, I am working on a project to get more pre-defined groups added to that list.
A few months ago the group "Asset Allocation" was already added at the top of the list and a few headers were inserted in the list to make it more readable.
The most used and probably most important set of RRG groups is listed under US-sectors. The first one is the group that holds all 11 sector ETFs (SPDRS) against SPY as the benchmark.
Underneath that group, you will find groups for each of these sectors, the individual stocks that make up that sector, with their respective sector indexes (ETFs) as their benchmarks.
Simply clicking on one of these groups will open up that universe on an RRG with the appropriate benchmark.
But There Is More
Very recently the header US MARKETS was introduced. Here you will find some general market-related groups like sets of Growth and Value indexes or Size (Small-, Mid-, and Large-cap indexes). But also the members of the Dow Jones Industrials index and the major markets and major indexes that have always been on the list.
Also new is the group of international stock market indexes, just above the group international ETFs. Now be careful here as these are quite different universes. The ETFs are all listed in the US and quoted in US Dollars and measured against SPY as the benchmark. The universe of stock market indexes looks at the actual underlying indexes and compares them against $DJW, the Dow Jones Global index.
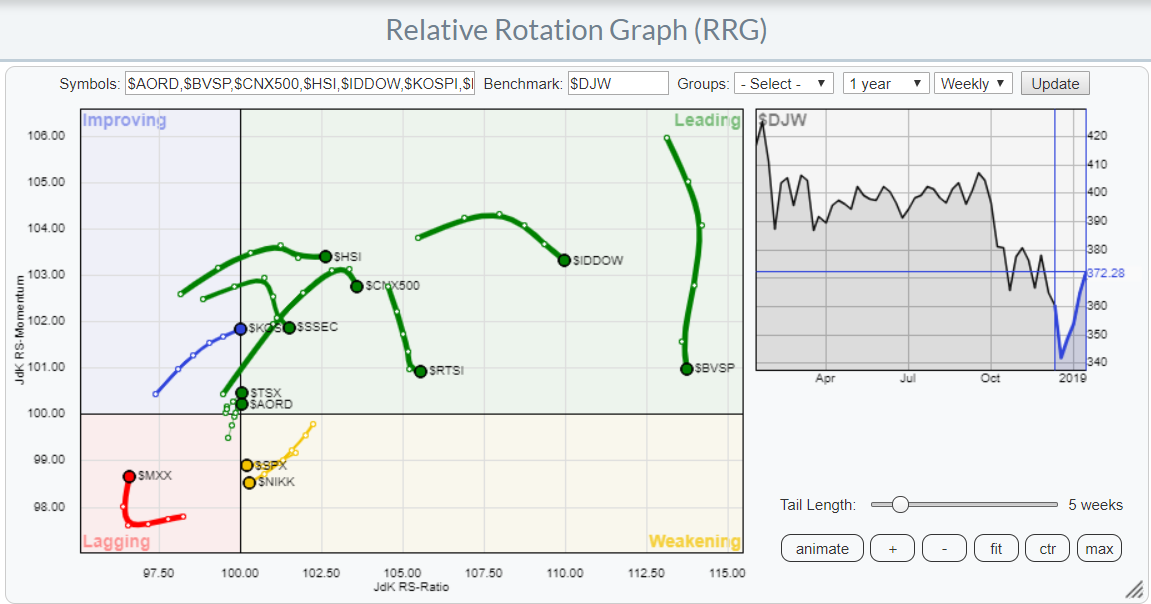 For example, the EWJ ETF that tracks the MSCI Japan index has a big FX component embedded as it is the is the price of the MSCI Japan index multiplied by the price of USD/JPY. This can, and probably will, be quite different from the $NIIKK index (Nikkei) in the other group. This is really something to be aware of as in these international ETFs there are essentially two markets (equity and forex) and thus two sets of supply and demand blending together. A gain in one component can be off-set by a loss in the other component and vice versa or they can re-enforce each other when the both move in the same direction.
The Canada and Commodity groups will be updated soon.
If you scroll further down you will also find two groups for currency universes. One using USD as the base and the other one using EUR as its base.
Plans Ahead
Looking forward I am planning to continue to add more of these predefined groups to this list in order to provide useable Relative Rotation Graphs that can be accessed without too much work on your part as well as providing a structure or a framework for analysis.
I am thinking about fixed income related groups like the components of the Government bond yield-curve. Maybe a pre-defined group with "factor ETFs" on which I wrote this article last week.
If you have any suggestions on particular groups or universes that you would like to see included please drop me a message at my email address which you can find below this article or drop a note in DISQUS as long as the discussion is still open for commenting.
FAANG Stocks
Despite the efforts to provide pre-defined universes to run RRGs on, there will always be people who want to look at customized universes. Be it a group of stocks that have some common denominator or the stocks that someone holds in a portfolio, the RRG function on Stockcharts.com makes that possible.
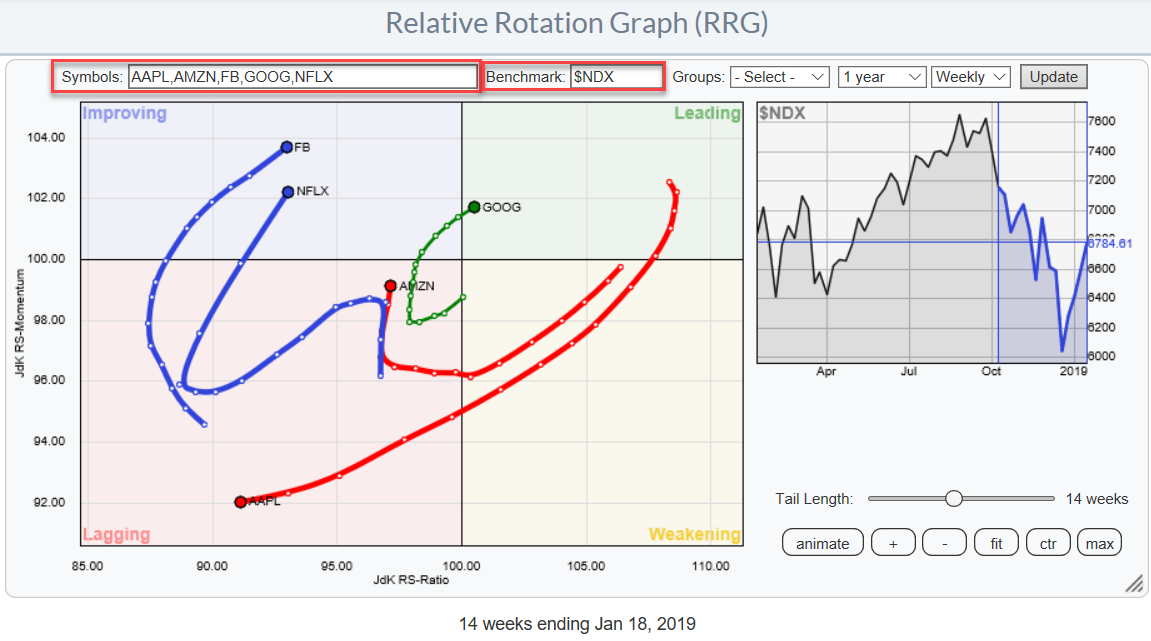 This Relative Rotation Graph above holds the five FAANG stocks (FB, AAPL, AMZN, NFLX, and GOOG). For the benchmark, I have chosen the NASDAQ 100 index, ticker $NDX.
It can really be any ticker symbols you like but I thought to use this one for a change instead of SPY or $SPX etc. which we see all the time.
What is interesting to see here is that four out of five have curled up and are now at a RRG-Heading between 0-90 degrees and GOOG has just crossed into the leading quadrant. The odd one out is still AAPL which is still pushing further into the lagging quadrant.
The quick takeaway from the RRG is that the original FANG stocks are worth keeping an eye on as they seem to be improving from a relative point of view but it seems better to avoid AAPL, at least for the time being.
If you like this RRG just click on the image and then "open the live image", it will open this RRG in a new tab. From there you can save this RRG as a bookmark in your browser and make it available at one click later on so you do not have to create it every time you want to inspect the FAANG stocks on a Relative Rotation Graph.
My regular blog is the RRG blog If you would like to receive a notification when a new article is published there, simply "Subscribe" with your email address using the form below.
Julius de Kempenaer | RRG Research
RRG, Relative Rotation Graphs, JdK RS-Ratio, and JdK RS-Momentum are registered TradeMarks ®; of RRG Research
Follow RRG Research on social media:
Feedback, comments or questions are welcome at Juliusdk@stockcharts.com. I cannot promise to respond to each and every message but I will certainly read them and where reasonably possible use the feedback and comments or answer questions.
If you want to discuss RRG with me on SCAN, please use my handle Julius_RRG so that I will get a notification.


