 This article was published in the RRG blog on 31 January and takes a look at the Bloomberg Commodity Index Groups through the lens of a Relative Rotation Graph.
When possible, I prefer to use data-sets that come from the same family and creating a "closed universe." This is a universe where all securities on the RRG together make up the benchmark that is used for comparison.
For the US sectors, we often use the 11 SPDR ETFs and compare them against SPY. All these ETFs together make up SPY.
For commodities, we can achieve a similar setup by using the Bloomberg commodity index family.
Bloomberg Commodity Index Family
The Bloomberg Commodity Indexes are a family of financial benchmarks designed to provide liquid and diversified exposure to physical commodities via futures contracts.
You can read up on this index family on the Bloomberg website. That page will also provide you with plenty of resources and information to understand how these indexes are constructed and maintained.
One document which I want to highlight, can be downloaded from that website (just click on the image below), is the overview of the 2019 BCOM Target Weights.
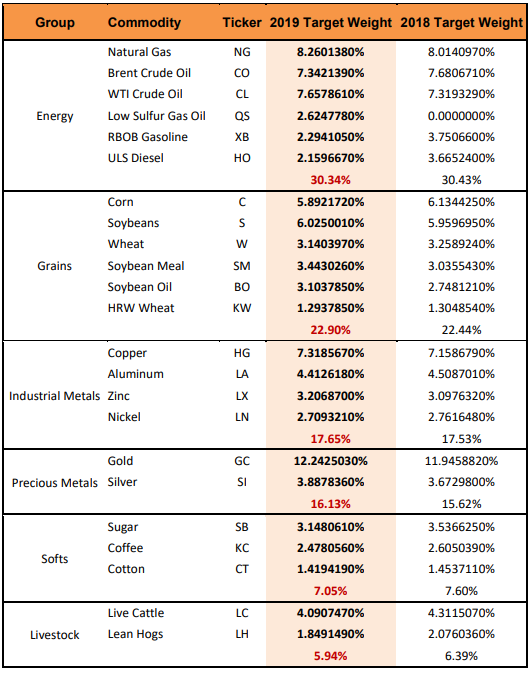 This overview shows the breakdown of the overall Bloomberg Commodity Index ($BCOM) into six groups. Each of these groups contains a number of individual commodity contracts.
You can compare the groups with the sectors in the stock market, and the individual commodities are the individual stocks.
The table below shows the ticker symbols in the Stockcharts database that are connected to these commodity groups.
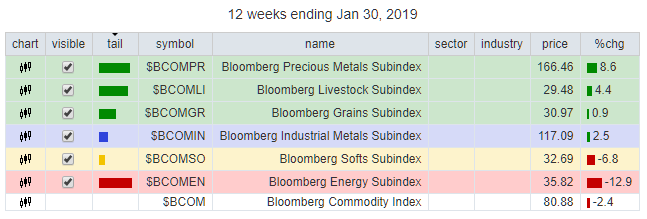 Just to be complete, for each of these symbols, including $BCOM, there is a Total Return equivalent available in the database. Simply add TR at the end of the symbol. So $BCOMTR is the Total Return equivalent of $BCOM and $BCOMPRTR is the TR equivalent of $BCOMPR and so forth.
Putting This Index Family On A Relative Rotation Graph
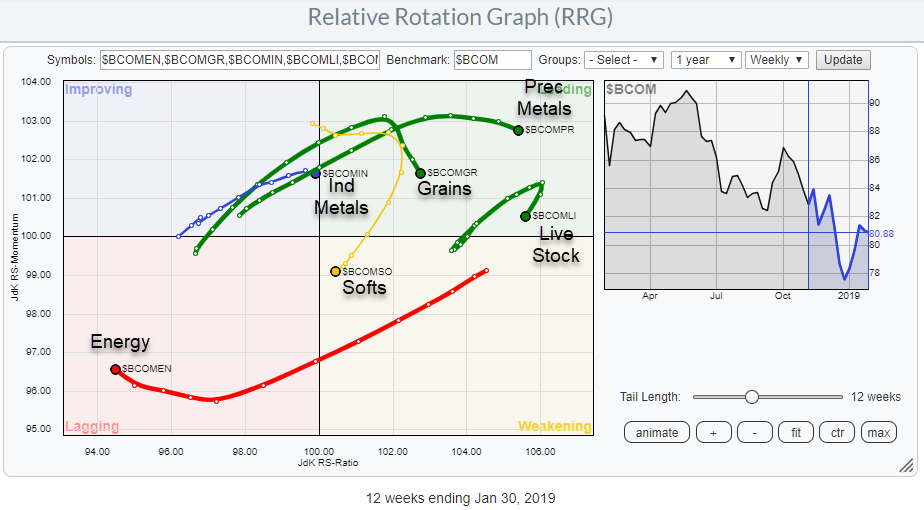 Putting these six groups on a Relative Rotation Graph and setting $BCOM as the benchmark gives the picture above.
To make things easy for you we have added this universe to the pre-defined groups on the RRG page. Just open the Groups drop-down selection and scroll down to the commodities section. The group in the RRG above is the first one in there, called Bloomberg Commodity Sub-indexes.
As you can see, here also, the rotational behavior of these groups around the center (benchmark) of the RRG shows up.
The first quick takeaway from this RRG is that Energy, which is the biggest group at 30% weight, is dragging the general commodity index down. This causes the other groups to cluster diagonally from the Energy group in order to keep the universe balanced around its benchmark.
On the opposite side, inside the leading quadrant, we find Precious metals still heading higher on the Jdk RS-Ratio scale but losing some relative momentum. The Industrial metals are about to enter the leading quadrant which may offer a good opportunity while we need to keep an eye on Softs as they are inside the weakening quadrant and rotating towards lagging.
Bloomberg Energy Subindex - $BCOMEN
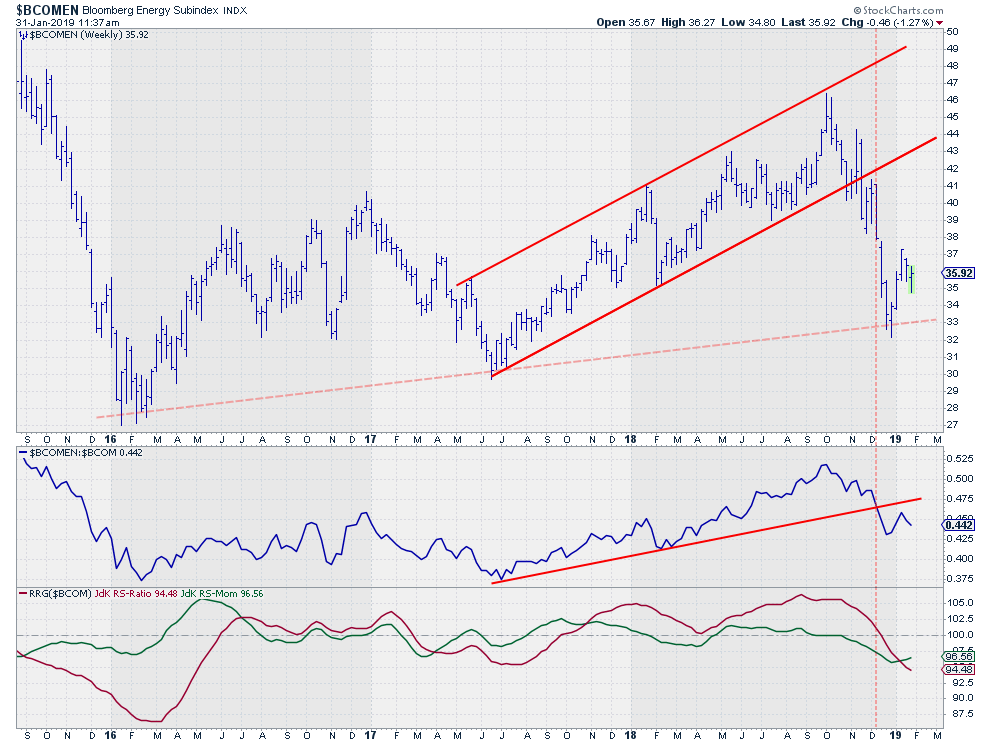 The uptrend in the energy group helped $BCOM going higher from mid-2017 to mid-2018 but was not strong enough to keep things up much longer when $BCOM peaked in May. The Energy group was able to continue on its own for a little while until October.
But when this group broke its rising support line the down-move that had already started in $BCOM only accelerated. Very rapidly Energy dropped to the level of its long-term rising support line (light-red dashed line). The current rally, for now, has to be interpreted as a recovery within the established downtrend.
That trendline and the recent low near $32 are important levels to watch. Another break lower will certainly fuel a further decline in Energy and therefore most likely also $BCOM.
Bloomberg Precious Metals Subindex - $BCOMPR
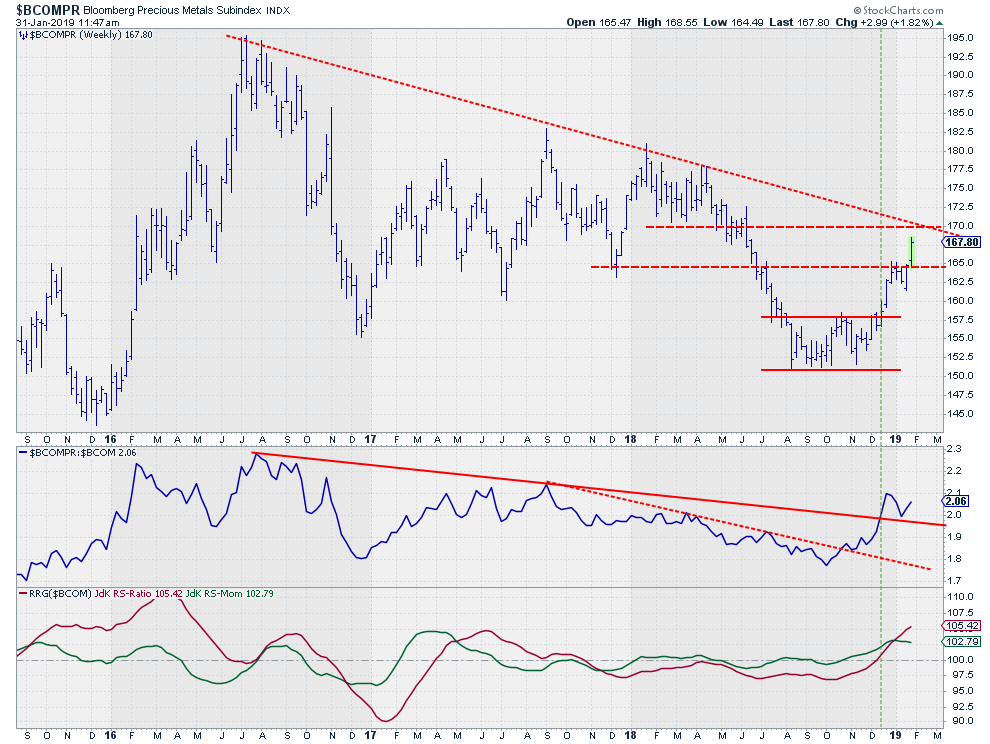 Precious metals completed a bottoming formation in the second half of 2018 when they broke out a trading range / double bottom towards the end of the year. That break ignited a strong rally which took $BCOMPR to its current levels, where the group is now closing in on resistance offered by the falling trendline as well as the horizontal level coming off a former low. Both around $170.
The relative strength line already managed to break its falling resistance line and even tested that line as support in a pullback move. This means that the relative trend is now up and with both RRG-Lines comfortably above the 100-level a further outperformance may be expected.
A break beyond $170 will accelerate such a move.
How To Trade?
In order to trade commodities you need a futures trading account and then you can only trade individual futures contracts. Which is a different ball-game from trading stocks altogether.
The good news is that iPath, which belongs to Barclays, has created ETNs (Exchange Traded Notes) that track the performance of the individual futures contracts that make up the groups in this index family.
Although technically, under the hood, ETNs are not the same as an ETF but they behave very much alike, they track the performance of a group of underlying financial products and the can be traded on an exchange.
iPath takes care of all the weightings and the rolling of the futures contracts when they expire etc.
In the drop-down with predefined groups, you will find the second group in the commodity section. This group holds the ETNs that belong to the groups we used above.
Here is the RRG for that universe.
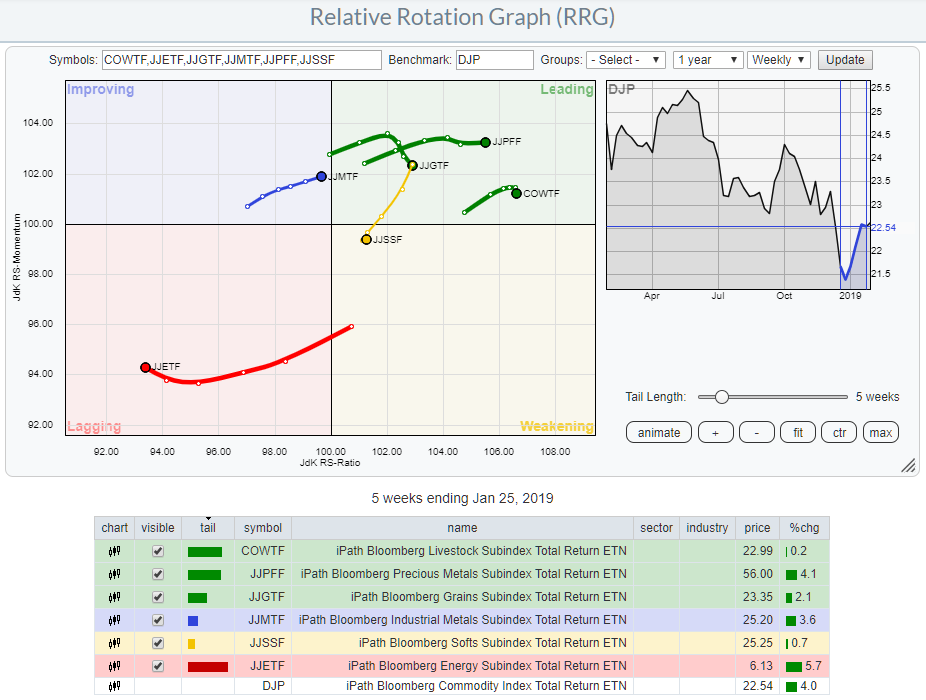 You may note that the ETNs are based on the Total Return indexes but that the picture does not differ much from the price based indexes. The same goes for the regular charts.
When the stock market goes through a rough patch, some diversification into another de-correlated asset class like commodities can be helpful. These ETNs provide an easy alternative to create "exposure" without having to go to the trouble of trading and managing multiple futures contracts.
My regular blog is the RRG blog If you would like to receive a notification when a new article is published there, simply "Subscribe" with your email address using the form below.
Julius de Kempenaer | RRG Research
RRG, Relative Rotation Graphs, JdK RS-Ratio, and JdK RS-Momentum are registered TradeMarks ®; of RRG Research
Follow RRG Research on social media:
Feedback, comments or questions are welcome at Juliusdk@stockcharts.com. I cannot promise to respond to each and every message but I will certainly read them and where reasonably possible use the feedback and comments or answer questions.
If you want to discuss RRG with me on SCAN, please use my handle Julius_RRG so that I will get a notification.


