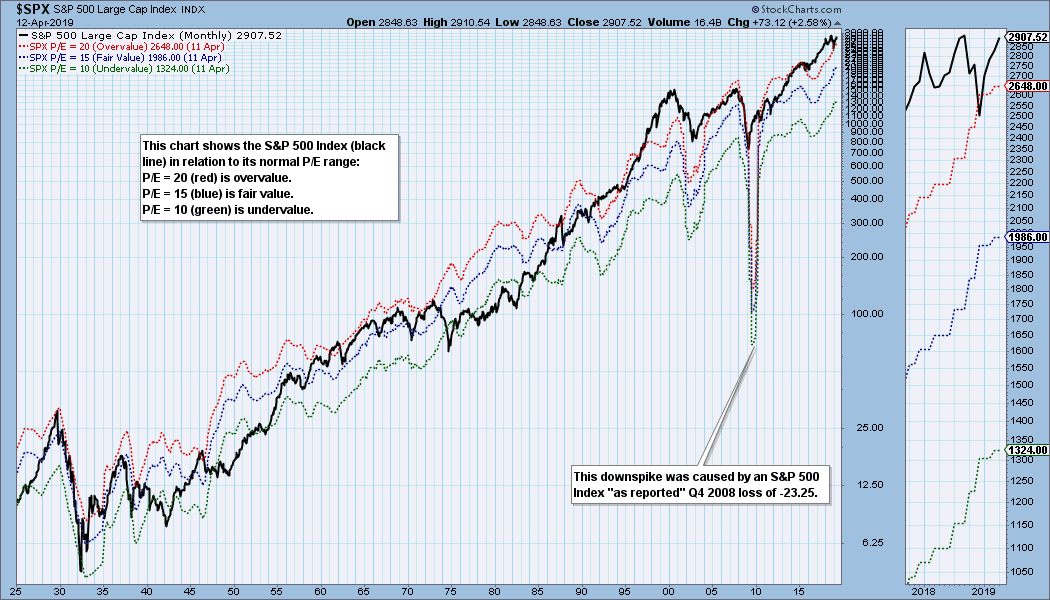
S&P 500 earnings for 2018 Q4 have been finalized, and with a P/E of 21.4, the market is above the normal value range and very overvalued. The following chart shows us the normal value range of the S&P 500 Index. It shows us where the S&P 500 would have to be in order to have an overvalued P/E of 20 (red line), a fairly valued P/E of 15 (blue line), or an undervalued P/E of 10 (green line). There are three hash marks on the right side of the chart to show where the range bands are projected be at the end of 2019 Q4. If earnings estimates hold and price doesn't change significantly, the market could be back in the normal range by year end, but it will still be overvalued.
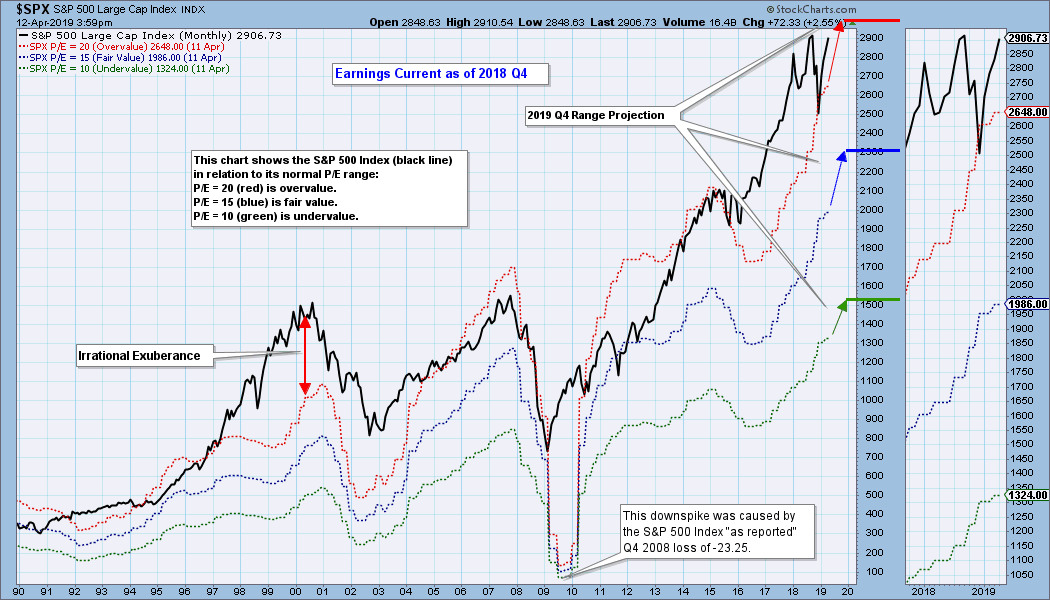
Historically, price has usually stayed below the top of the value range (red line); however, since about 1998 it is not uncommon for price to exceed normal overvalue levels. The market hasn't been undervalued since 1984.
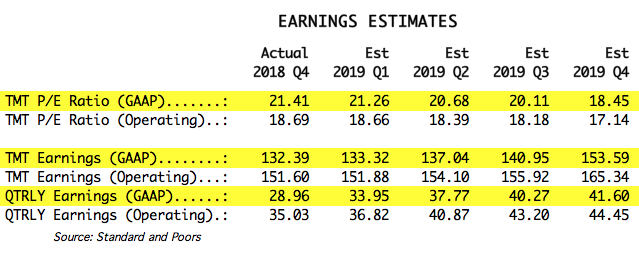
The table below shows how earnings are expected to improve going forward, but the drop in P/E shown is only possible if price doesn't rise significantly. In the best case shown (2019 Q4), the market will be close to fair value, but this depends upon price being about the same level as it is now.
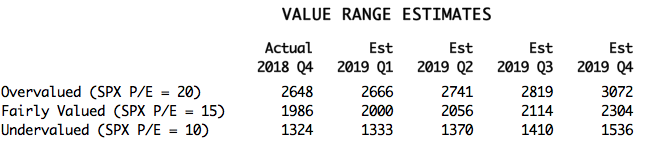
The following table shows where the colored bands will be using forward earnings.
CONCLUSION: These earnings charts are intended to provide an historical context for current earnings, and to demonstrate that overvaluation is not your friend. The S&P 500 is back outside the normal value range, and it is very overvalued. Historically, overvalued conditions leave the market vulnerable for a large correction or bear market, but valuation assessment is not a precise timing tool.
Technical Analysis is a windsock, not a crystal ball.
Happy Charting!
- Carl
Helpful DecisionPoint Links:
DecisionPoint Shared ChartList and DecisionPoint Chart Gallery
Price Momentum Oscillator (PMO)
Swenlin Trading Oscillators (STO-B and STO-V)


