Editor's Note: This article was originally published in Martin Pring's Market Roundup on Tuesday, June 4th at 2:57pm ET.
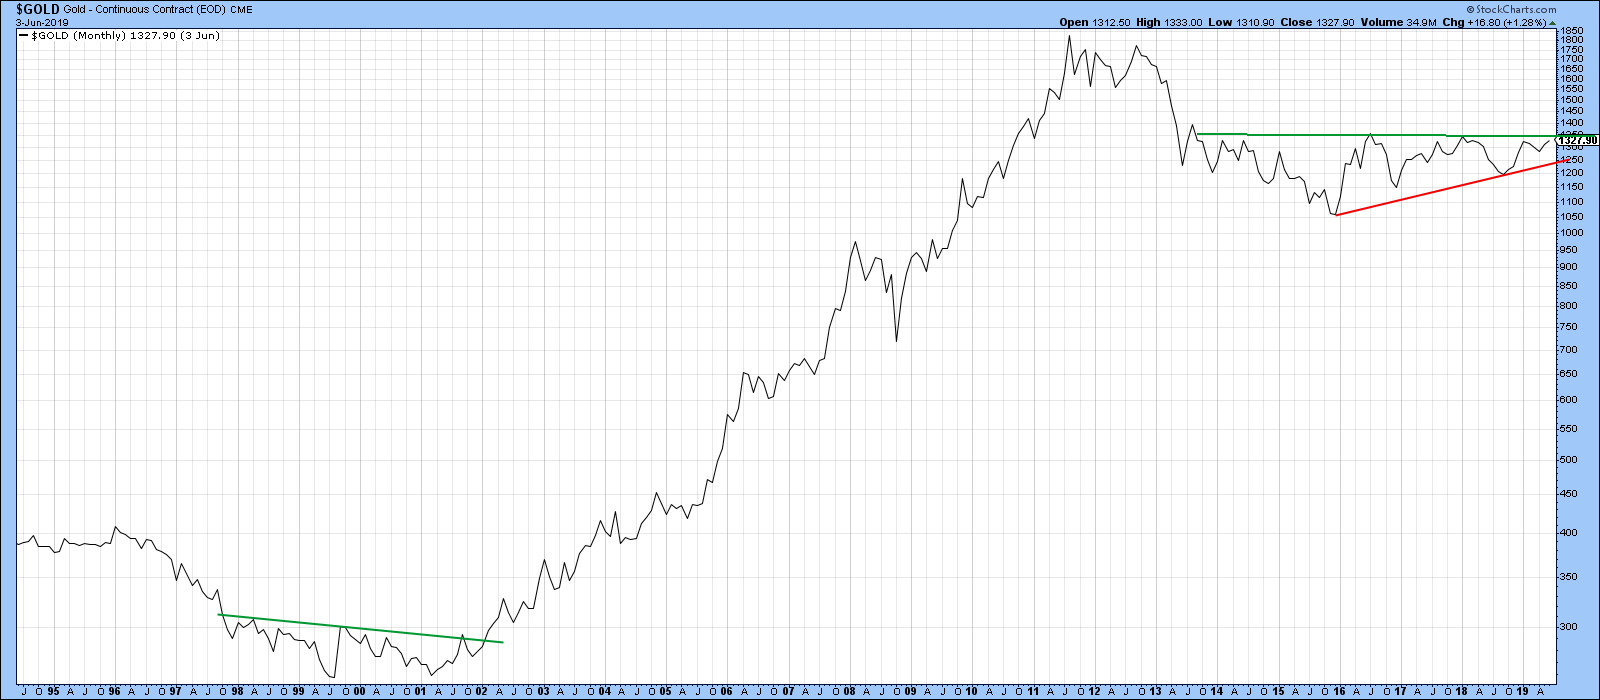
From a long-term aspect, Gold looks as though it is in the process of duplicating its action at the turn of the century by forming a huge base. Of course, it will only a base once it has completed with a decisive move above the $1350 area, an event that looks close to happening but has not done so yet.
 Chart 1
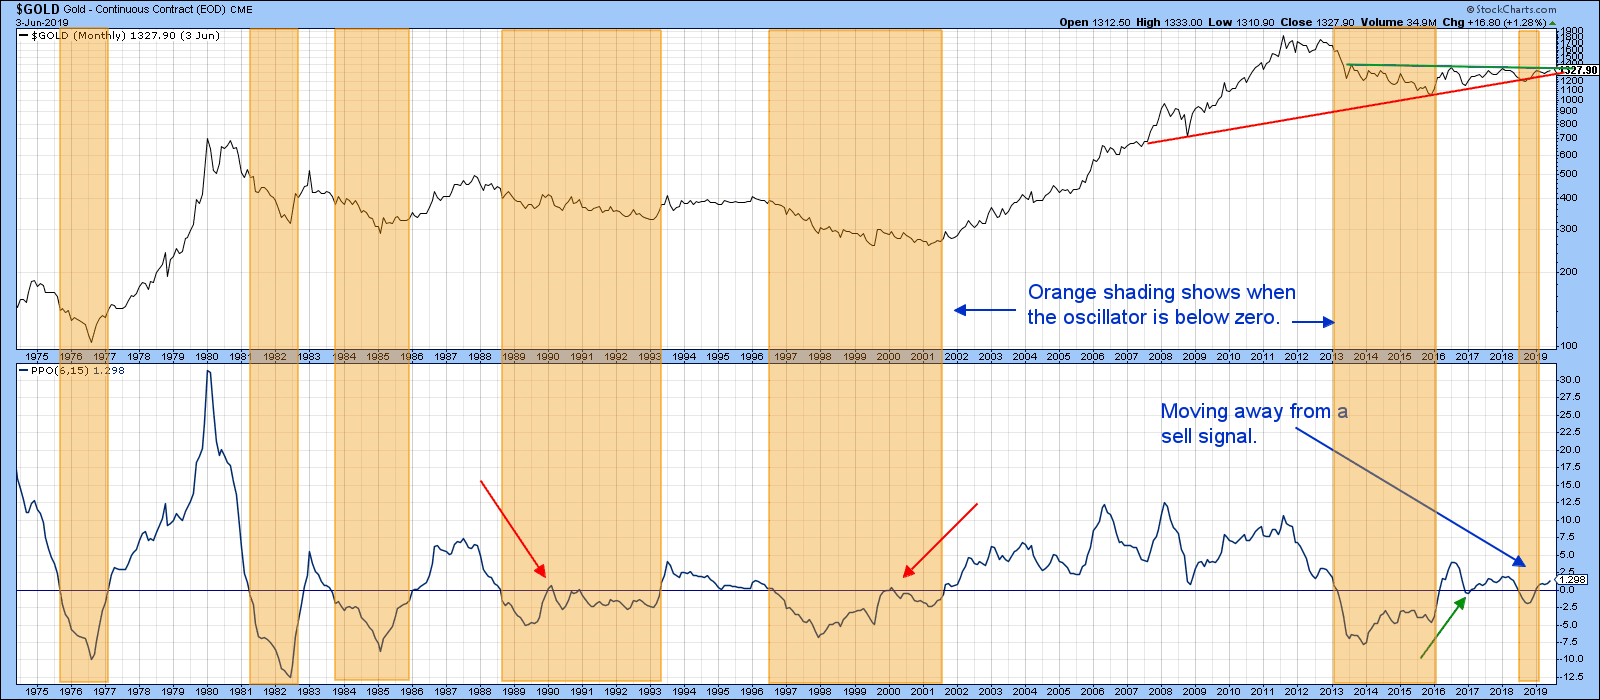
What has occurred is that the price oscillator (bottom window of Chart 2) has re-enforced its recent bullish signal by moving further away from the equilibrium line. One of the reasons why I like this indicator is that it does not generate much in the way of whipsaws. Since 1975, there have only been three whipsaws, flagged below by the one green and two red arrows. All of this increases the odds that Gold will break above that resistance sometime this year.
 Chart 2
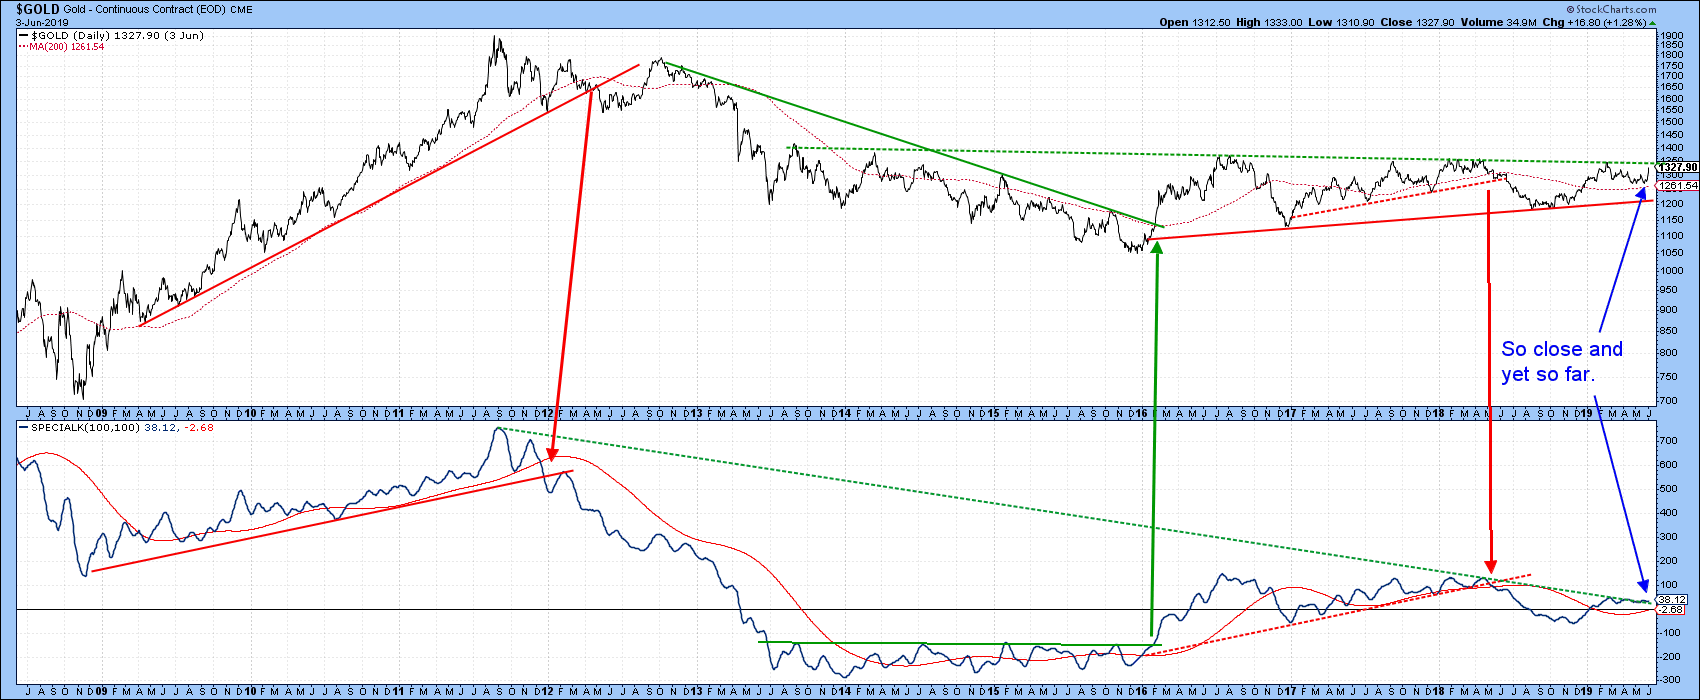
We can see how close a break may be in Chart 3, which plots the daily price action. Note that the Special K, which you can read about here, is also right on its bear market trend line, so virtually any strength whatsoever from current levels, will result in a joint breakout.
 Chart 3
Good luck and good charting,
Martin J. Pring
The views expressed in this article are those of the author and do not necessarily reflect the position or opinion of Pring Turner Capital Group of Walnut Creek or its affiliates.


