Listen, the media loves to overhype the trade war. Seriously, is there anyone that isn't aware of the trade war, the tweets, the rhetoric, etc. at this point? Hasn't everyone already priced in an economic disaster because of it? Oh wait! That's right, our economy is still growing and the jobs market is still expanding. I'm tired of all the trade war talk. It's baked in! There are at least three bigger issues in my view as we enter the month of September, so let's go over them one at a time, from the smallest risk to the biggest risk:
September
That's right. One issue is simply that it's September. The S&P 500 has produced annualized returns of -5.51% during the month of September since 1950. On the surface, that's a significant problem, as we're about to embark on the only calendar month of the year that has fallen more often than it's risen over the past 7 decades. A simple look at the seasonality tool confirms a fairly bleak outlook:
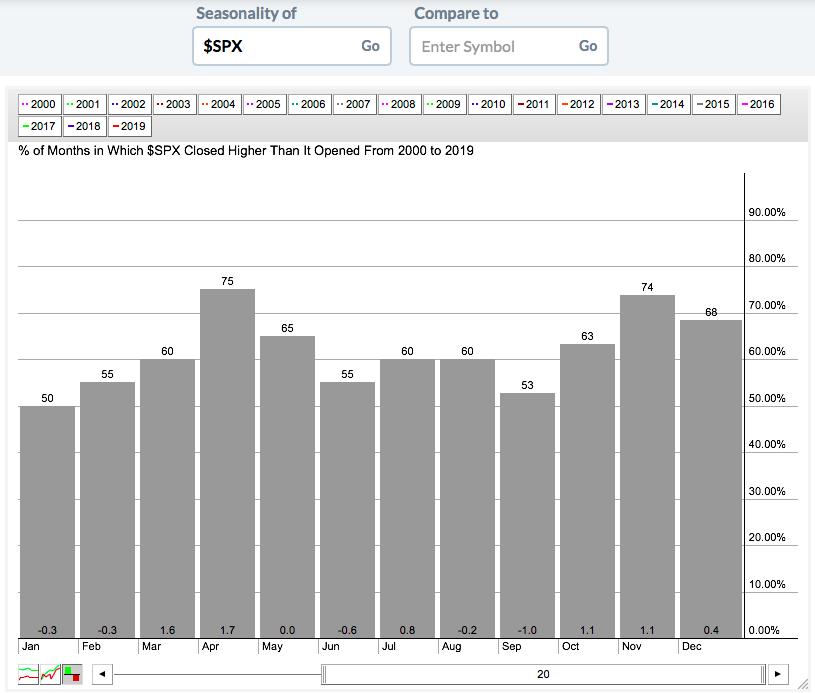
We do have to keep one thing in mind: this is just the last 20 years, which includes two nasty bear markets from 2000-2002 and 2007-2009 that fell during that last secular bear market.
But I'm a historian, so of course I had to dig a little deeper. Here's what I've found. Septembers during secular bear markets (1969-1981 and 2000-2012) have produced annualized returns of -13.82%. Meanwhile, Septembers during secular bull markets have produced annualized returns of -0.35%. I certainly wouldn't do cartwheels after looking at that last number, but flat is a much different picture than big losses. No matter how we slice it, though, September is not a great month and presents a hurdle for those like me in the bullish camp.
Volatility
An increasing Volatility Index ($VIX) is associated with falling equity prices. Here's another seasonal chart to look at, this time pertaining to the VIX:
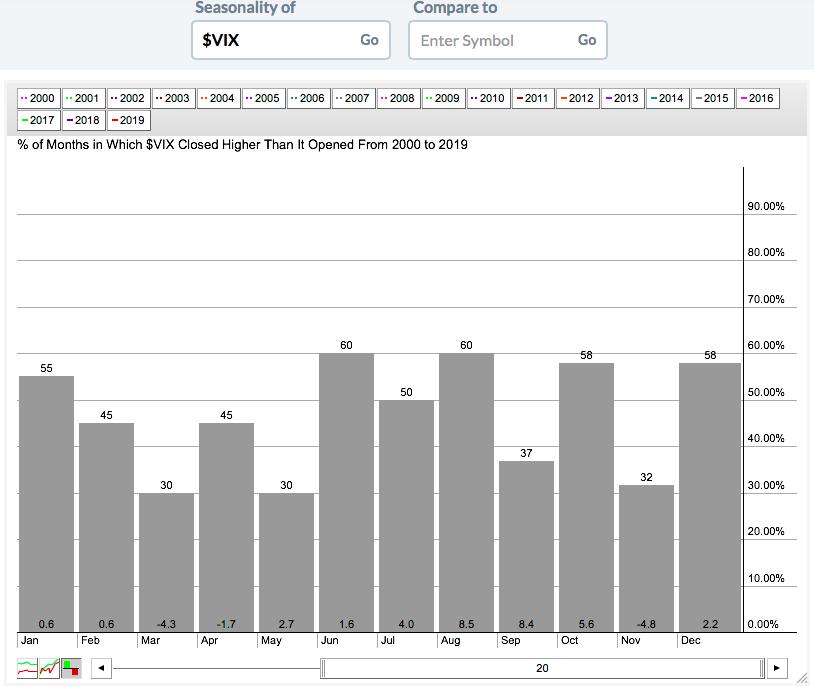
As you can see, the biggest gains in the VIX typically occur during July, August and September. Despite the "go away in May" mantra, I've pointed out countless times that mid-July-to-late-September is the period when you really want to go away - and the above seasonal chart "bears" this out. But of course, once again, I had to do a little more research regarding the VIX over the past 20 years.
August and September normally have that bearish 1-2 punch; over the last 20 years, when the VIX is elevated heading into September, the odds of a bigger decline increases. In 2019, we're entering September with a VIX of 18.98, which is below the average of 19.86 on August 31st this century. 11 of the last 20 years have seen a VIX below that 19.86 average heading into September. Only 1 of those 11 years produced a September return worse than -1.55% (2000, when the S&P 500 fell 5.35%). To the contrary, if the VIX is above 20 heading into September, we've seen September returns of -11.00% (2002), -9.21% (2008), -8.17% (2001) and -7.18% (2011).
Currently, 2019's VIX level of 18.98 seems to suggest that we won't see the steep declines associated with some of those secular bear market years.
The Federal Reserve
Honestly, in my mind, this is the stick of dynamite. We have already seen the market aftermath of Hurricane (Fed Chief) Powell on three occasions in the past 9 months. I don't know if we can take another direct hit. While most media folks are pitting Fed Chief Powell against President Trump, I believe it's more Fed Chief Powell vs. the BOND MARKET. The bond market sends us signals all the time. It's a very smart market, much smarter than the stock market in my view. The signals here have been very clear since Q4 2018. In case you haven't noticed, let me show you what the bond market has been saying:
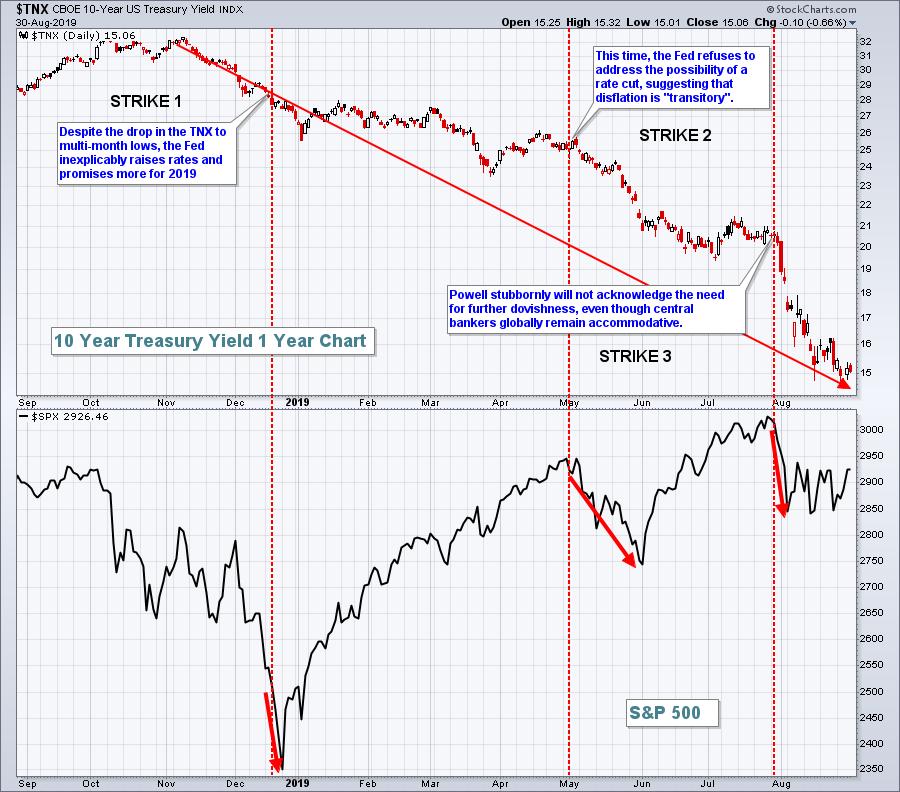
While yields have tumbled from 3.25% to 1.50%, the Fed has moved from a rate-hiking campaign to finally agreeing to lower the fed funds rate a quarter basis point. But the bond market wants a lot more - and the Fed needs to lower rates further.
I've been asked "Why should the Fed lower rates if our economy is strong?" That's a fair question. If inflation was at or above the Fed's target level, then I'd say the Fed should stand pat. But here's the problem. Central bankers are dovish everywhere around the globe. Standing pat here strengthens the dollar, which, in turn, weakens commodity prices. The Fed's mandate is to maximize employment and to stabilize prices. Because the threat of disinflation remains high with a strong currency, the Fed has the opportunity and the ability to lower rates - and the bond market is SCREAMING for it!
I blame the Fed for the inverted yield curve. Lowering shorter-term rates would immediately correct that inversion or potential inversion.
For the first time in a very long time, I can say that the Fed has become an enemy of the stock market. I have little doubt that we're in a secular bull market and that U.S. equity prices are ultimately going higher. But I cannot say, with certainty, that we won't see a rapid decline at some point in September. Based on history, it could be right after the next Fed meeting on September 17-18.
I still see many positive signs and believe the next couple years could see an explosion to the upside in the S&P 500. If I'm right (or even if I'm wrong), it's critical to stick with leaders - leading sectors, leading industries and leading stocks. Combining those relative strength leaders with excellent fundamentals, namely beating Wall Street estimates as to both quarterly revenues and EPS, is the focus of our EB Digest newsletter, which is published 3x a week. It's a FREE newsletter and I'd love for you to join our growing community of knowledgable investors and traders. CLICK HERE to sign up.
As always, I appreciate your support!
Happy trading!
Tom


