In my latest "Don't Ignore This Chart" article, I used a Relative Rotation Graph holding 20 stocks as a starting point to find an interesting-looking rotation and a possible trading opportunity for BHGE. The question: how was I able to select those 20 stocks to include on that RRG?
The answer: making use of the tools and functionality that is available on StockCharts.com!
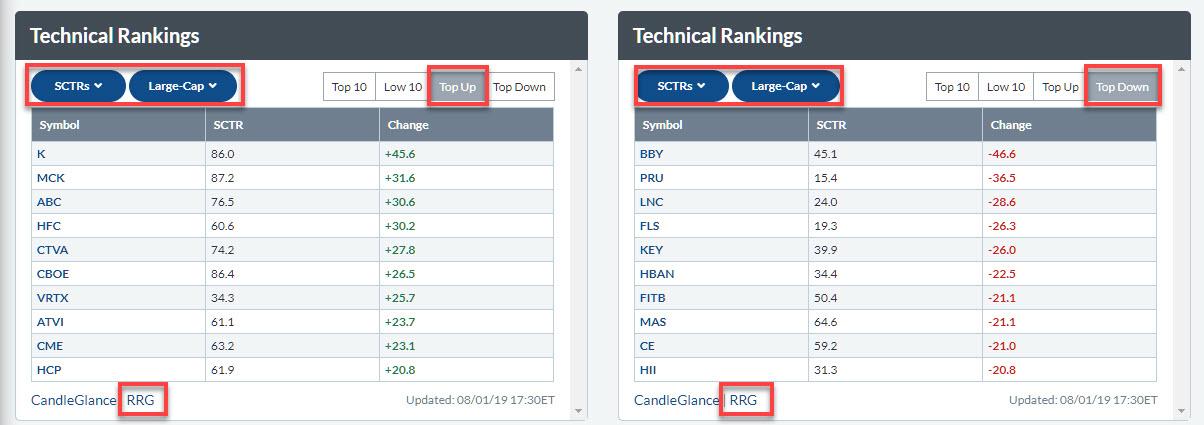
In this particular case, I started on my dashboard. The image above is a screenshot of part of my Your Dashboard page, where I have two widgets side-by-side displaying the top UPward SCTR movers and the top DOWNward SCTR movers. The universe is limited to large-cap stocks to make sure we will have decent trading volume available and no exceedingly jumpy SCTR changes from day to day.
As you may have noticed, there is an RRG link below both of those widgets. Clicking that link will open up the RRG page, with the ten stocks in that table against the benchmark S&P 500.
Obviously the ten UPward moving SCTRs will show more-or-less positive rotations on the RRG, while the ten DOWNward moving SCTRs will show predominantly negative rotations on an RRG.
To keep an eye on all 20 movers on one RRG, I simply copy all the symbols in the RRG for DOWN movers and paste these symbols at the end of the input box of the RRG for UP movers.
Here are the steps you need to accomplish this:
- Open Your Dashboard
- Duplicate browser window in another tab
- Click the RRG link for Top SCTR DOWNmovers
- Select all symbols in the symbol-entry box and copy
- Go to the browser window that still holds Your Dashboard
- Click the RRG link for the Top SCTR UPmovers
- Put cursor at the end of the symbol entry box
- Add a comma, then paste the symbols you copied in step 4.
- Click "Update"
- Voila, you now have a Relative Rotation Graph holding the top ten UP and DOWN SCTR movers to work from.
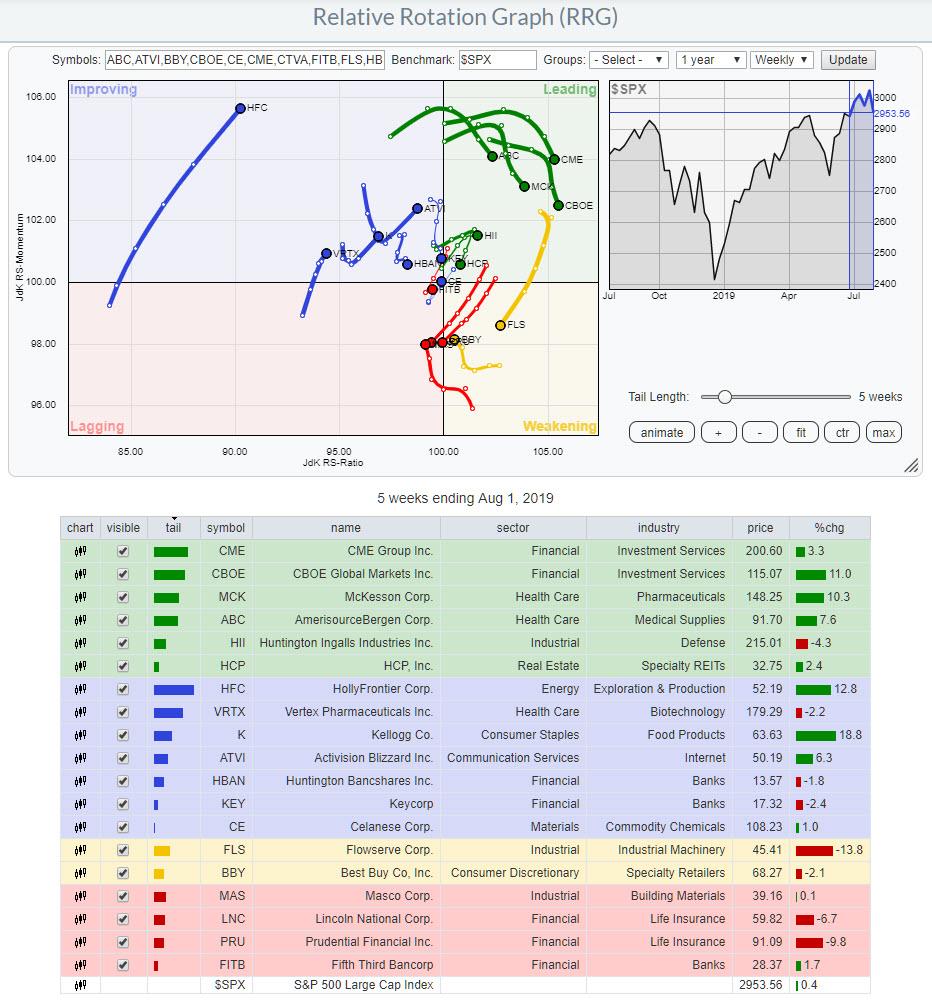
From that freshly created RRG, I can now follow my normal workflow to analyze the universe. As you know, RRGs can help you narrow down a selection and give you a high-level overview of what is going on in the market as it enables you to see the (relative) movement of a universe of stocks in one graphical representation.
From that overview, I encourage people to follow their usual workflow. RRG was never designed to replace what people are used to doing in the process of analyzing markets. But RRG definitely helps you keep an eye on the big picture and save time in finding new trading ideas and/or monitoring your portfolio.
This approach of using the Top SCTR movers as input for your RRGs also means that you will have a dynamic universe that changes every day with the moves that take place in the market, keeping you on top of new developments.
On the RRG above, I have identified a few trails that interest me for further investigation. either positive or negative. The RRG below shows only these trails for cleaner visuals.
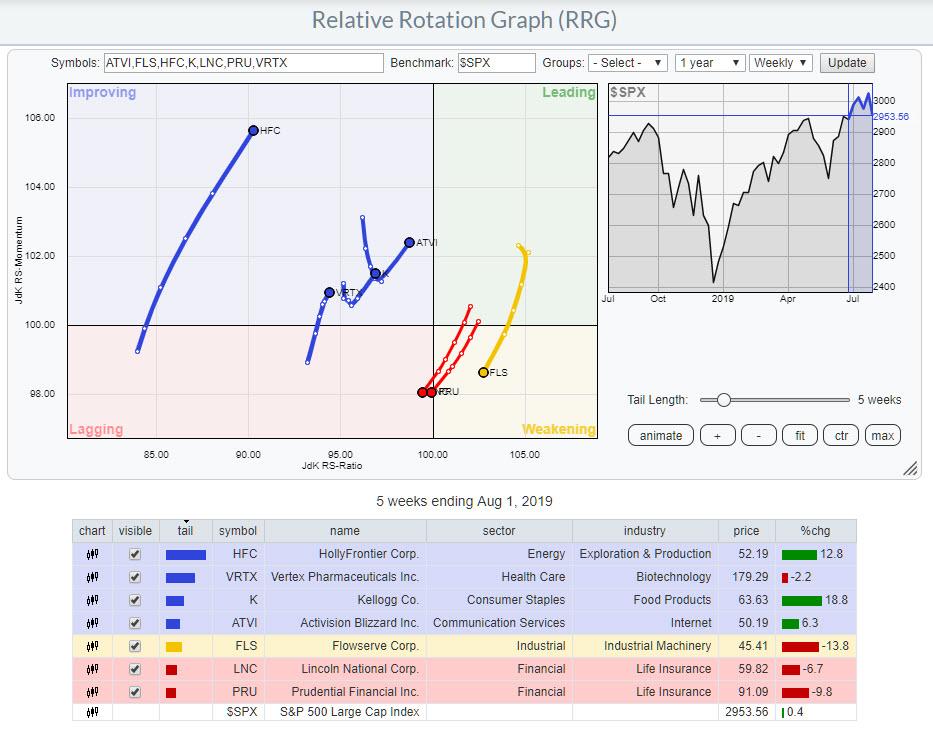
Going over the price graphs, with relative strength indicators, I found two/three potential trading opportunities.
K vs. PRU pair trade
The first and second opportunities, as this is about two stocks, are in K and PRU.
On the RRG, K is inside the improving quadrant and has just hooked back up towards the leading quadrant. PRU, on the other hand has just entered the lagging quadrant and is heading further into it at a negative RRG-Heading.
Looking at their two price charts, I noticed that K has just completed a double bottom formation, while PRU has just completed a double top.
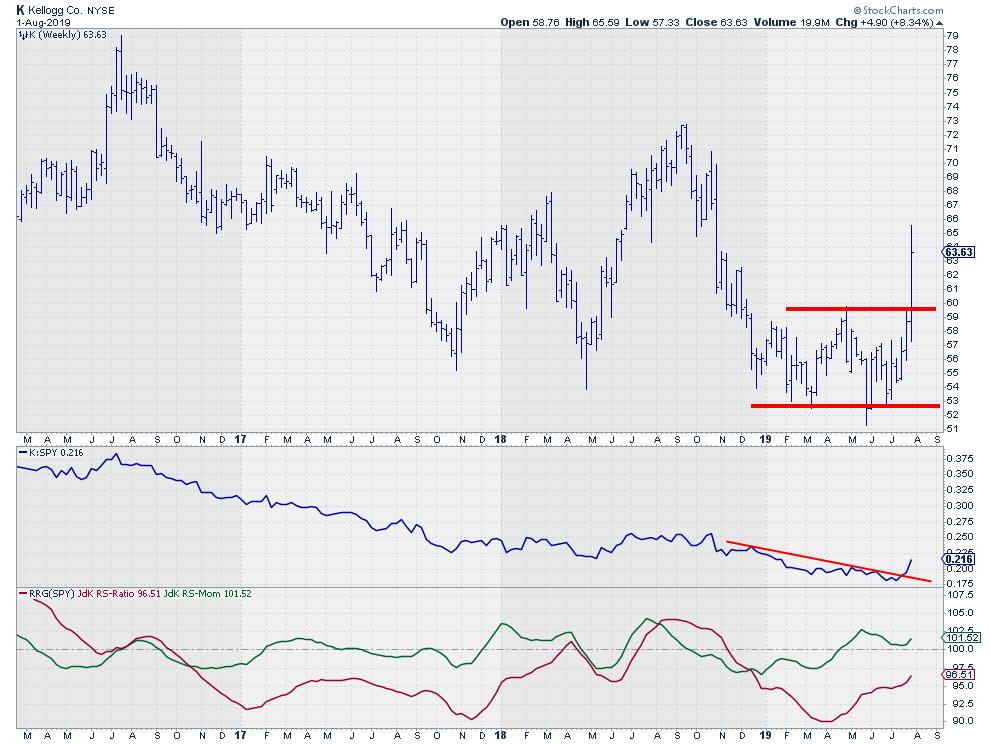
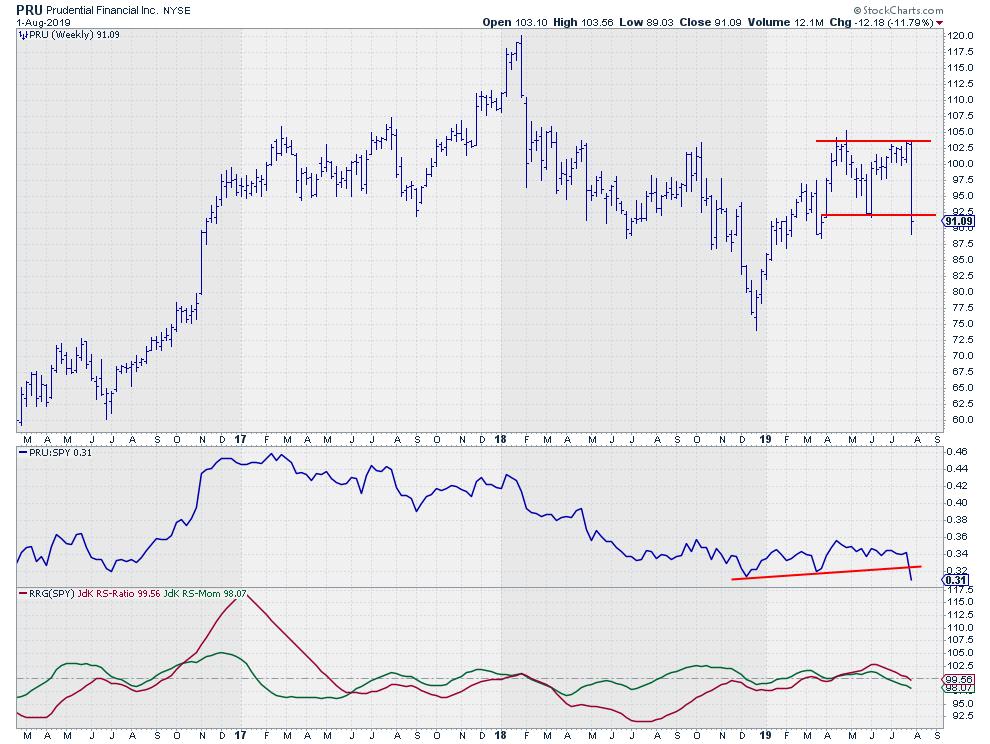
The opposite rotations on the Relative Rotation Graph, in combination with the opposite double top/bottom formations, make this a potential pair trade to watch/execute.
The only caveat for this one is that the jump in K may have gone too far away from the breakout level already, which adds a bit of risk to the trade.
Activision Blizzard - ATVI
The stock with the most interesting combination of rotation and price development (imho) is ATVI.
On the RRG, ATVI is positioned inside the improving quadrant and just "hooked" back at a heading towards the leading quadrant. These "hooks" are very rapid rotations that are simply too fast for the time frame, in this case weekly, to be picked up as a clockwise rotation.
That this is in fact a clockwise rotation becomes clear when you switch to a daily version of the RRG, where you will find ATVI having just entered the leading quadrant after completing a full rotation through all quadrants over the past six weeks.
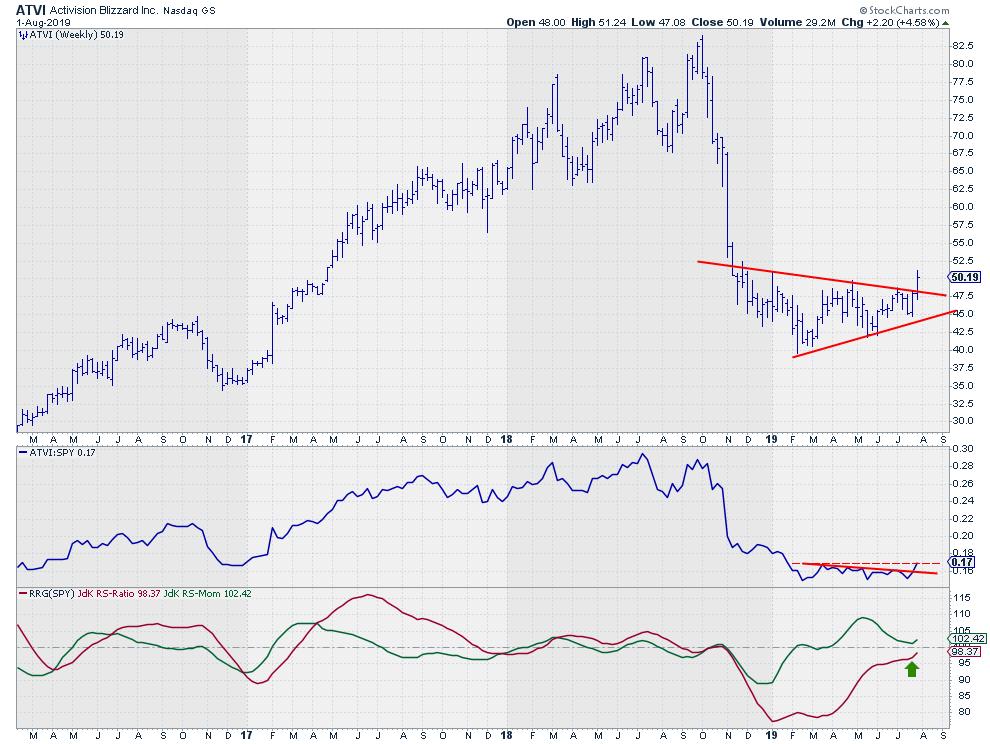
On the weekly price chart, ATVIS has just completed a bottom formation and started moving higher. We still have one more trading session to go before that last bar becomes a real weekly bar with a weekly close, but the fact that ATVI has been able to fight against the weak market of the last few days is another sign of strength. $47.50 seems to be a solid support level for now.
Out of the 20 stocks on the RRG with which I started this article, via the four interesting positive rotations, I think ATVI is the stock with the best risk/reward ratio for coming weeks.
My regular blog is the RRG Charts blog. If you would like to receive a notification when a new article is published there, simply "Subscribe" with your email address.
Julius de Kempenaer
Senior Technical Analyst, StockCharts.comCreator, Relative Rotation Graphs Founder, RRG Research
Want to stay up to date with the latest market insights from Julius?
– Follow @RRGResearch on Twitter– Like RRG Research on Facebook– Follow RRG Research on LinkedIn– Subscribe to the RRG Charts blog on StockCharts
Feedback, comments, or questions are welcome at Juliusdk@stockcharts.com. I cannot promise to respond to each and every message, but I will certainly read them and, where reasonably possible, use the feedback and comments or answer questions.
To discuss RRG with me on S.C.A.N., tag me using the handle Julius_RRG.
RRG, Relative Rotation Graphs, JdK RS-Ratio, and JdK RS-Momentum are registered trademarks of RRG Research.
Julius de Kempenaer
Senior Technical Analyst, StockCharts.com
Creator, Relative Rotation Graphs
Founder, RRG Research
Host of: Sector Spotlight
Please find my handles for social media channels under the Bio below.
Feedback, comments or questions are welcome at Juliusdk@stockcharts.com. I cannot promise to respond to each and every message, but I will certainly read them and, where reasonably possible, use the feedback and comments or answer questions.
To discuss RRG with me on S.C.A.N., tag me using the handle Julius_RRG.
RRG, Relative Rotation Graphs, JdK RS-Ratio, and JdK RS-Momentum are registered trademarks of RRG Research.


