This week has been an interesting one for the transports. Transports traditionally include Railways, Trucking and Airlines, but, for the purposes of this article, we'll add the Autos in.
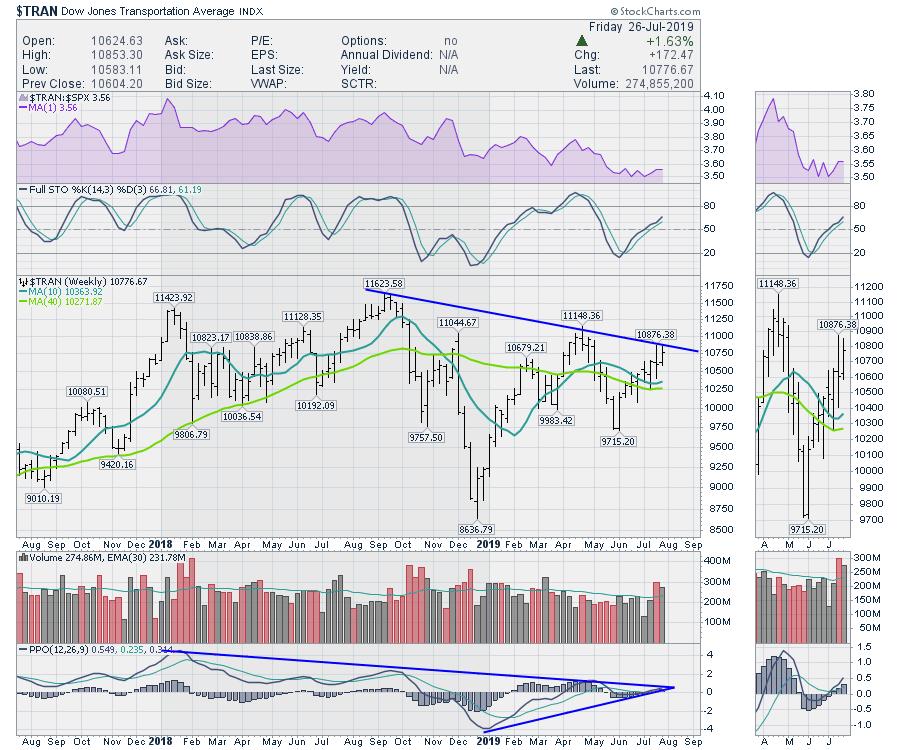
First, let's take a look at the transports index. Transports have underperformed against the $SPX, as shown in the top shaded panel. When this purple area chart trends up, the transports would be outperforming. The full stochastic still has a positive slope, so that is bullish. Looking at price, we still have a series of lower highs in place. The last two weeks saw some explosive volume, including options expiration Friday and lots of earnings releases. I do like that the PPO has just turned up around the zero level, as you can see in the zoom box. The next goal will be to break the two-year downtrend in momentum on the PPO. Just a broad look at the transports suggests a sideways chart for the last two years.
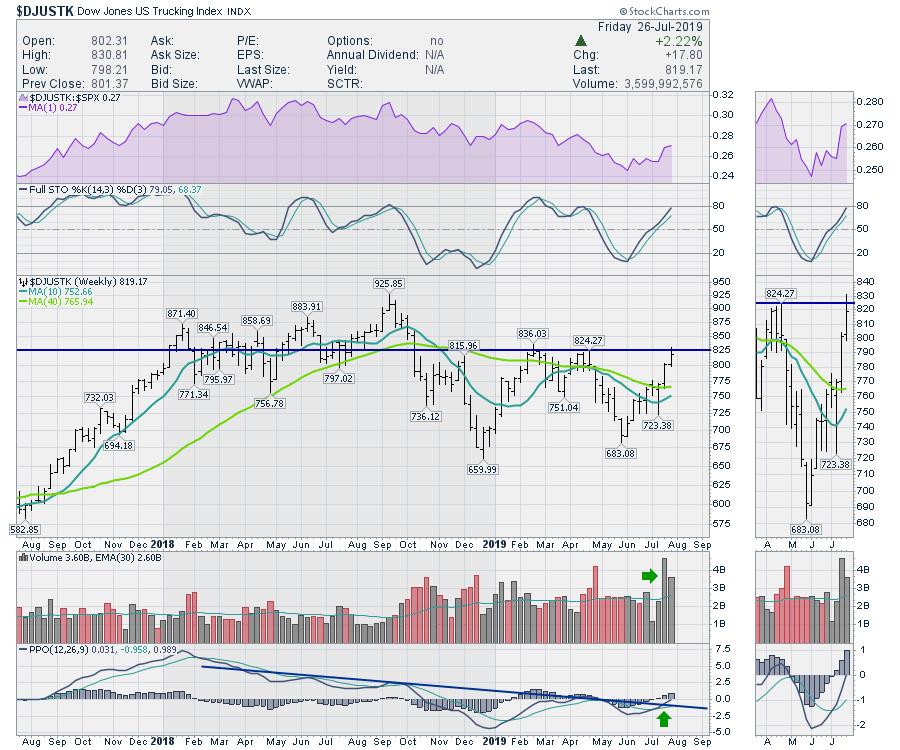
The Trucking chart has been surging since the earnings from the big carriers. They mentioned a slowdown in volumes, but the chart has been running on 18 wheels for June and July. I do like the fact that the PPO has a clear momentum trend line that has been broken; that looks very bullish to me.
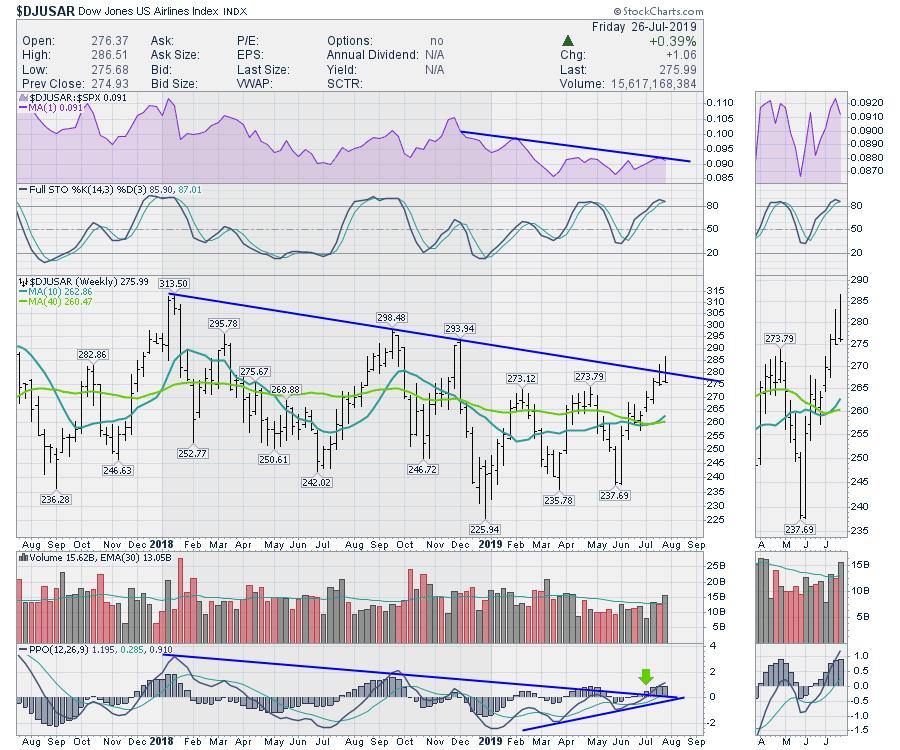
The airline index has had two big selling bars the last two weeks. This chart has some weakness in relative strength, shown in purple. While the price bars of the last two weeks broke the trend line, they also retreated and closed on the lows, which looks weaker. That adds a little caution. Once again, the downtrend on the PPO, which measures momentum, has been broken. I find that very bullish.
Next is the railroads. I have used a different timeline for the railway chart. The reason is that this chart also broke down in 2015 in a timely fashion, telling us about an impending top in the market. I'm bringing it to your attention this week because of the break in relative strength after a two-year uptrend. The purple area charts show the railroads close to the four-year uptrend in relative strength as well. One interesting reason to pay close attention to the railways is that railroads are the only charts in the transport index I can find which reflect some sort of a signal towards the broader market. So, when the railroads break their relative strength uptrend, it is worthy of remembering. Also, notice how cleanly they trend in relative strength.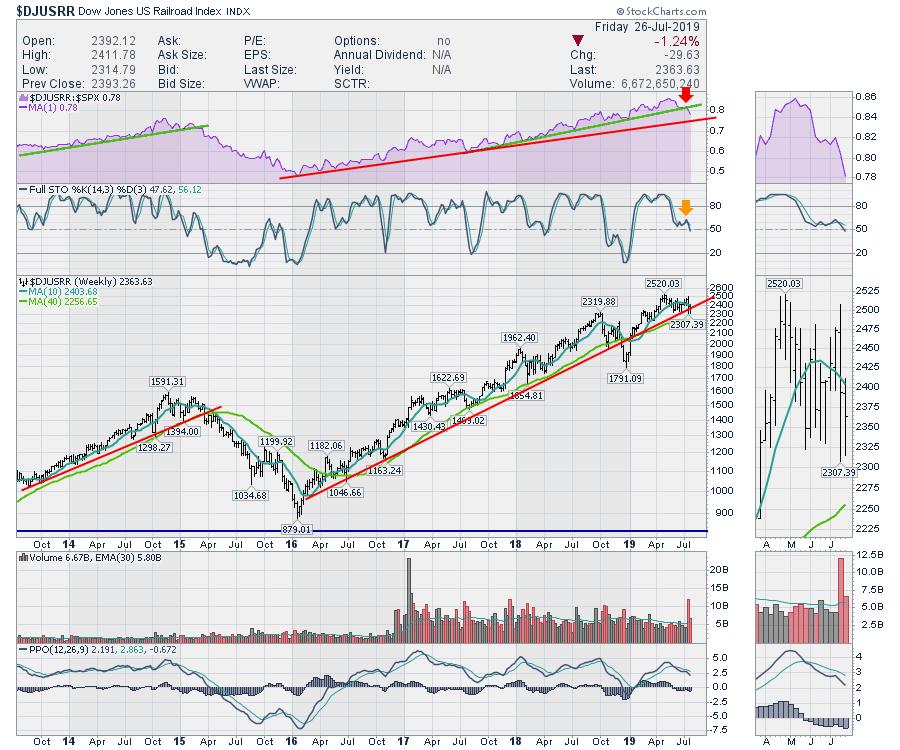
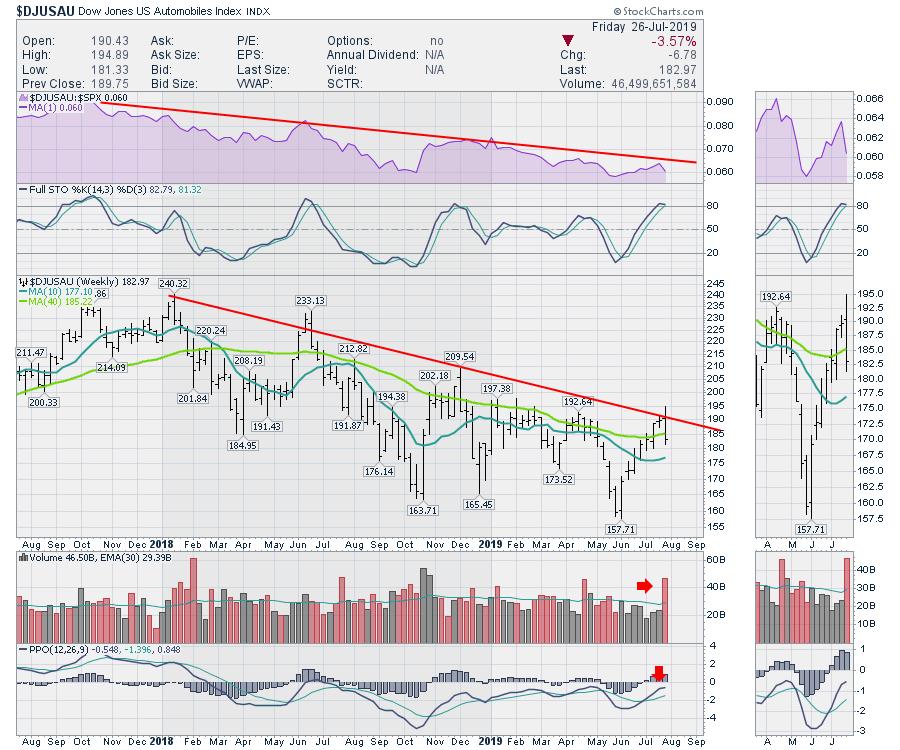
Here is the autos chart. With the weakness in Tesla and Ford this week, the chart is hurting following a nice run up. With the PPO trapped below zero and no momentum higher, this looks like an industry group to avoid. That was a vicious outside bar to wrap up the week.
In summary, the truckers chart looks better than the earnings information. Watch closely to see if it can break horizontal resistance. The airlines selling bars suggest caution. The break in the clean trend of railway outperformance to the SPX is a big red flag for me, one I'll be watching closely. Lastly, the autos look like an avoid.
Thus, while the top two charts have been a sideways mess, it's the potential for trend change on the railways that concerns me the most. Just like a late night drive in the country with the glow of the dashboard lights... be careful when crossing railway tracks.
Good trading,
Greg Schnell, CMT, MFTA
Senior Technical Analyst, StockCharts.com
Author, Stock Charts For Dummies
Want to stay on top of the market's latest intermarket signals?
– Follow @SchnellInvestor on Twitter
– Connect with Greg on LinkedIn
– Subscribe to The Canadian Technician
– Email at info@gregschnell.com


