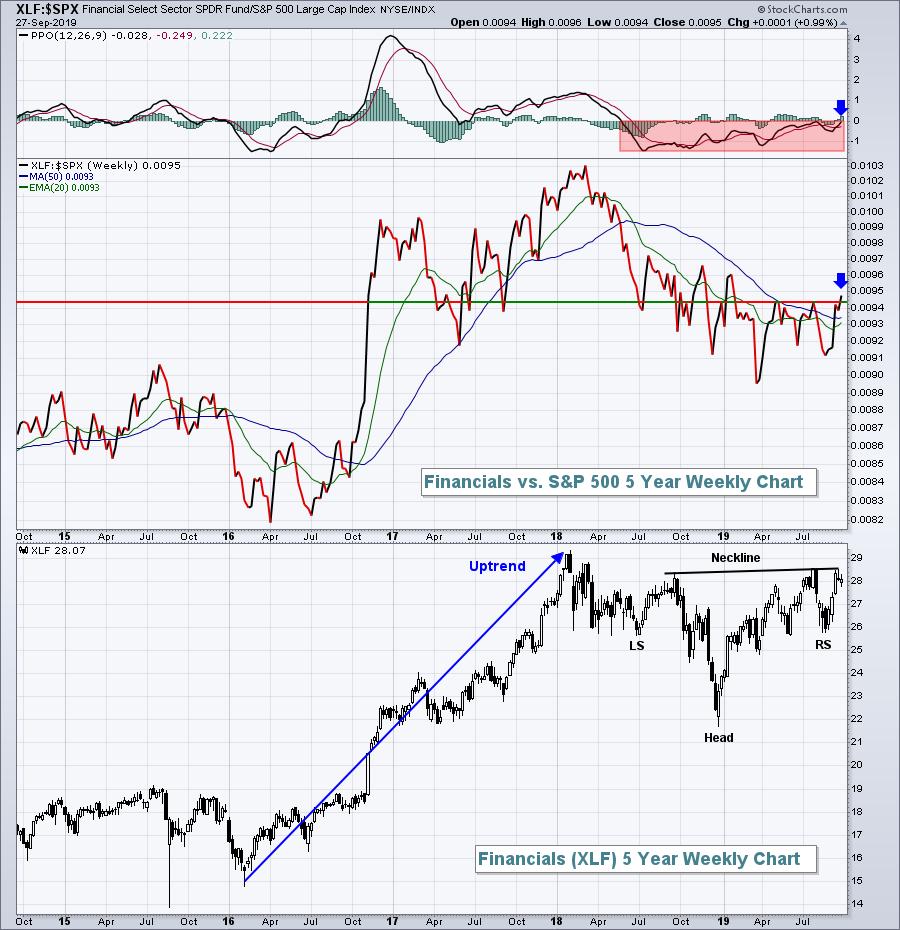
Financials (XLF) had been rather dormant for nearly 18 months - at least on a relative basis to the S&P 500 - but that is all about to change. While the group is certainly beginning to flex its collective muscle, the real confirming signal would likely be a 10-year treasury yield ($TNX) break above its earlier September high of 1.90%. The following is a relative chart vs. the benchmark S&P 500. In particular, check out the relative momentum (PPO):

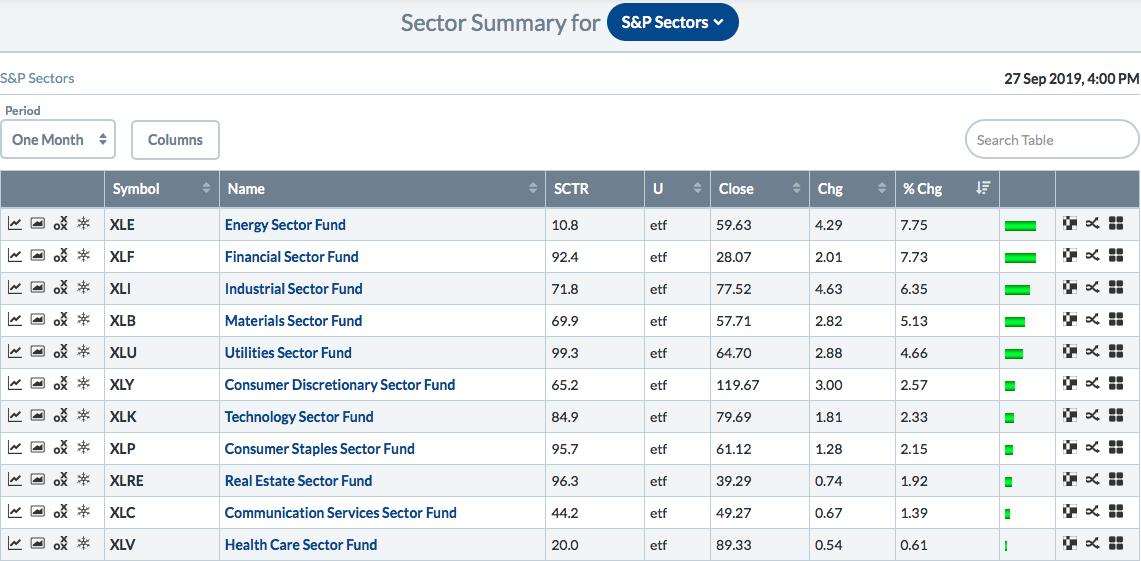
A positive relative PPO is important because it tells us that momentum on a relative basis has begun to shift the financials' way. Over the past month, financials have moved into a leadership role. Another way to look at that here at StockCharts.com is to look at the sector summary. Here's the leaderboard over the past month:

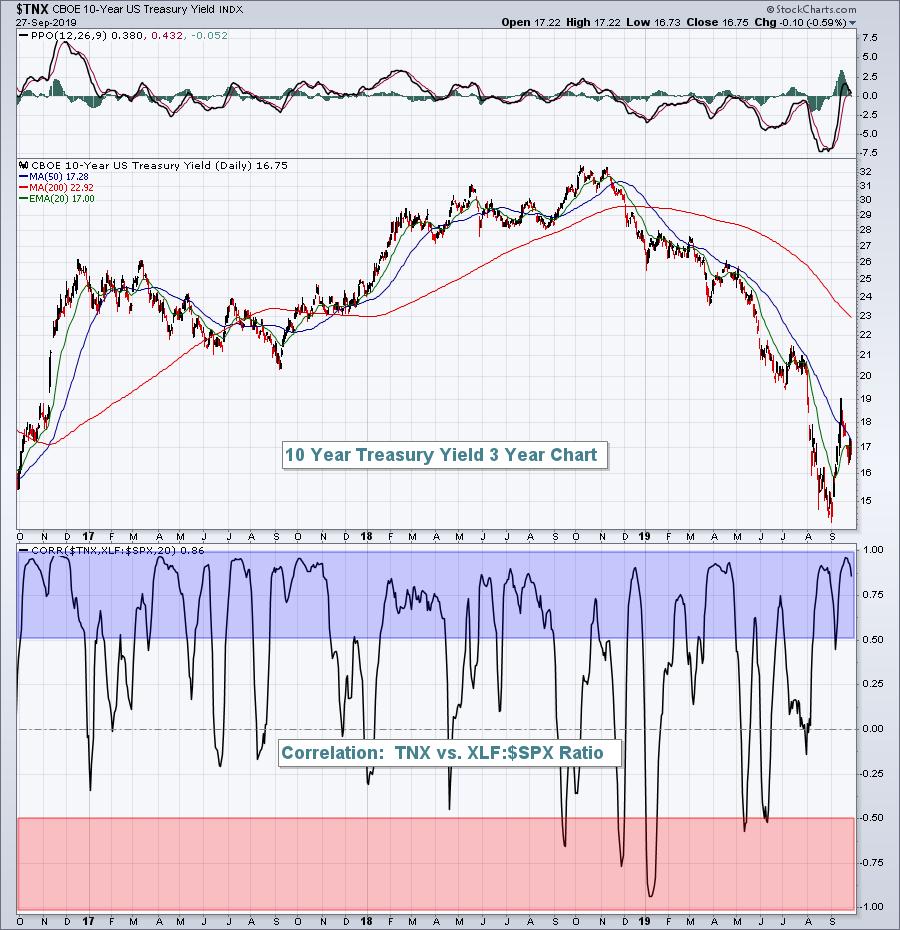
It's a little too early to say that this leadership role will continue, but the big clue will most likely be the direction of the TNX. When the TNX is on the move higher, the XLF:$SPX ratio usually is too. Check out the positive correlation here between the two:

The blue-shaded area illustrates just how positive the correlation between the TNX and the XLF:$SPX ratio truly is. The red-shaded area highlights periods where the two move in opposite directions.
If you're investing in financials, particularly banks ($DJUSBK), life insurance ($DJUSIL), investment services ($DJUSSB) and asset managers ($DJUSAG), watch the TNX for further clues. A break above 1.90% and we're likely to see significant outperformance by the financial sector continuing into Q4.
Please join the EarningsBeats.com community by subscribing to our FREE EB Digest newsletter. I publish it every Monday, Wednesday and Friday before the stock market opens; the focus is on relative strength and earnings. CLICK HERE to sign up!
Happy trading!
Tom


