Recently, a reader responded to one of my articles on the S&P 500 and asked about the value of support and resistance levels on a broad market index. He explained that support and resistance seems to make sense for individual stocks, as they're based on people's reactions to a stock trading at a certain price level, resulting in that specific price level having meaning to the market.
But how would that make sense for a broad market index, which is not in and of itself a tradable vehicle?
That's a fair question... and here are three reasons why the answer is absolutely "Yes!"
First, a broad-market index like the S&P 500 is comprised of about 500 (it's actually 505 at the moment, I believe) individual stocks. If the price of an individual stock represents the supply/demand picture for that stock, then the value of index should represent the aggregate supply/demand for all of the companies in the index.
Many equity indices are market cap-weighted, meaning the largest companies in the index can make quite a large impact on the movement in the index. To put another way, investors' decisions on the largest stocks are what will be most reflected in the index value.
All of this means that the value of an index has meaning, and that the value of an index relative to its previously meaningful values also has meaning.
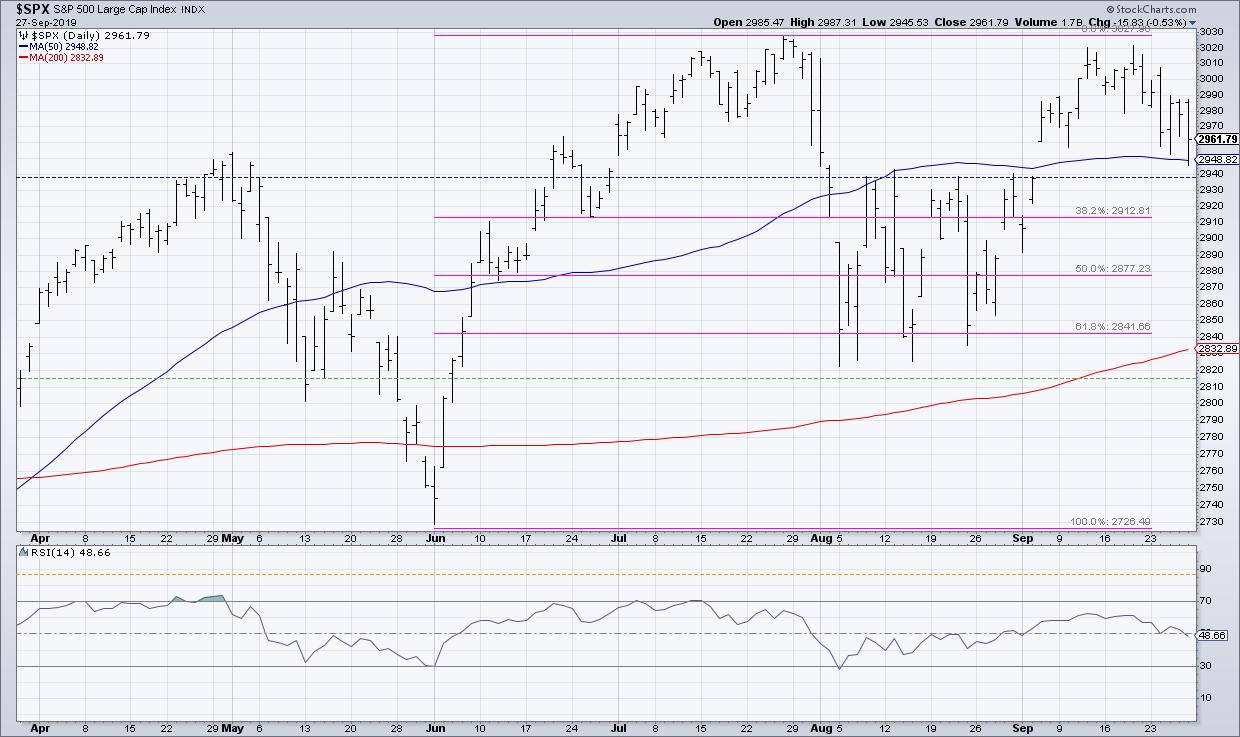
That 2940 level on SPX has meaning because investors see it and react to it.
Second, with the prevalence of passive investment strategies, especially index ETFs, more and more people are tied directly into the returns of the broad market indexes. As more people watch ETFs, I would argue that key price levels (see the third point on psychological levels!) become more relevant as investors will make buy and sell decisions based on those specific price levels.
The market has a memory, and investors tend to anchor themselves to price levels based on their entry points. The more that people use ETFs as an investment vehicle, the more of a chance that a key support or resistance level will be noted and reacted to by investors.
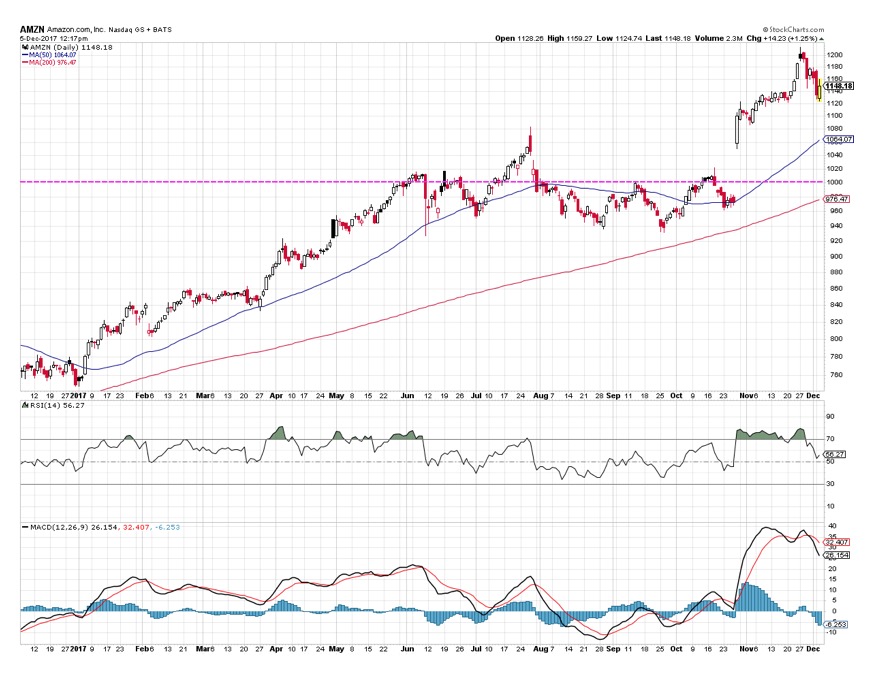
Finally, we have the phenomenon of psychological levels, where certain price points have meaning just because people believe they do. This is often known as "big round number" theory, the idea that stocks tend to find support or resistance at big round numbers like 100 or 1000.
Check out this chart of Amazon ($AMZN) from 2017. Notice how important the 1000 level became over the course of the year.
The Dow Jones Industrial Average breaking 10,000 had no particular economic meaning, but, psychologically, it made a huge difference that we needed another column to start quoting the Dow. Dow 10,000 hats were running rampant on the NYSE floor to signify this momentous occasion!
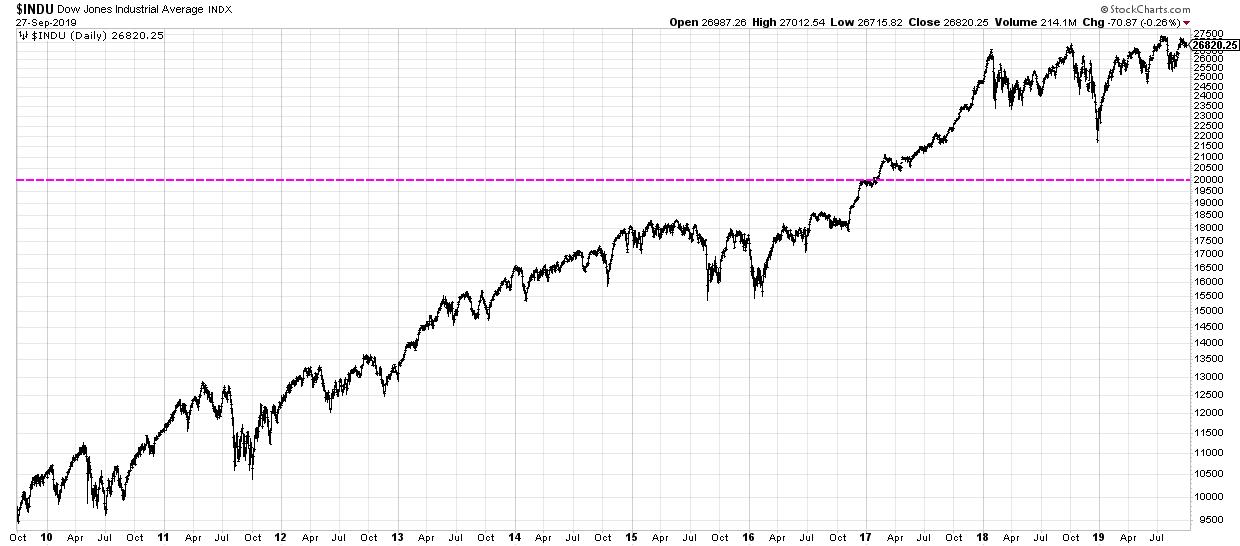
Did Dow 20,000 have any significant economic significance? No, not really...
So, if you ask me why resistance levels are valid on the broad market level, I would say it all comes down humans. Humans anchor specific price levels (and even program computers to do so as well!), humans follow index ETFs and pay attention to where they're moving, and humans attribute greater importance to certain levels based purely on their psychological significance.
Put simply, as long as humans are still involved, then price levels have meaning.
RR#6,
Dave
David Keller, CMT
Chief Market Strategist
StockCharts.com
David Keller, CMT is Chief Market Strategist at StockCharts.com, where he helps investors minimize behavioral biases through technical analysis. He is also President and Chief Strategist at Sierra Alpha Research LLC, a boutique investment research firm focused on managing risk through market awareness. He is a Past President of the Chartered Market Technician (CMT) Association and most recently served as a Subject Matter Expert for Behavioral Finance. David was formerly a Managing Director of Research at Fidelity Investments in Boston as well as a technical analysis specialist for Bloomberg in New York. You can follow his thinking at MarketMisbehavior.com, where he explores the relationship between behavioral psychology and the financial markets.
Disclaimer: This blog is for educational purposes only and should not be construed as financial advice. The ideas and strategies should never be used without first assessing your own personal and financial situation, or without consulting a financial professional.
The author does not have a position in mentioned securities at the time of publication. Any opinions expressed herein are solely those of the author, and do not in any way represent the views or opinions of any other person or entity.


