Editor's Note: This article was originally published in John Murphy's Market Message on Thursday, September 5th at 10:46am ET.
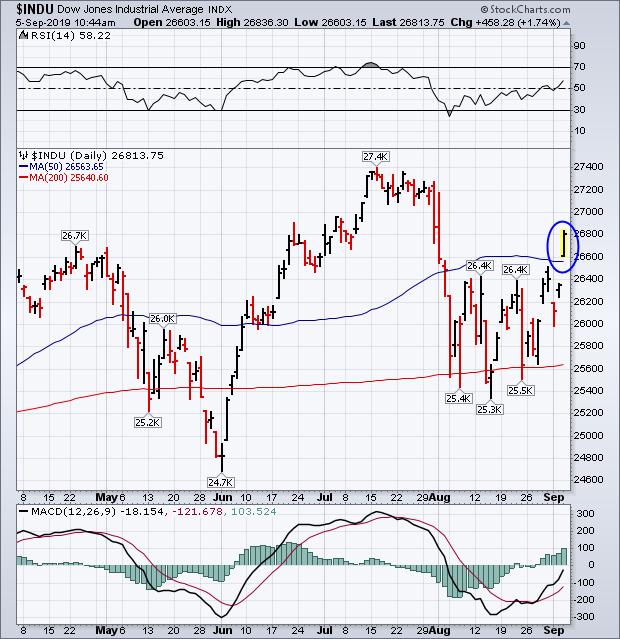
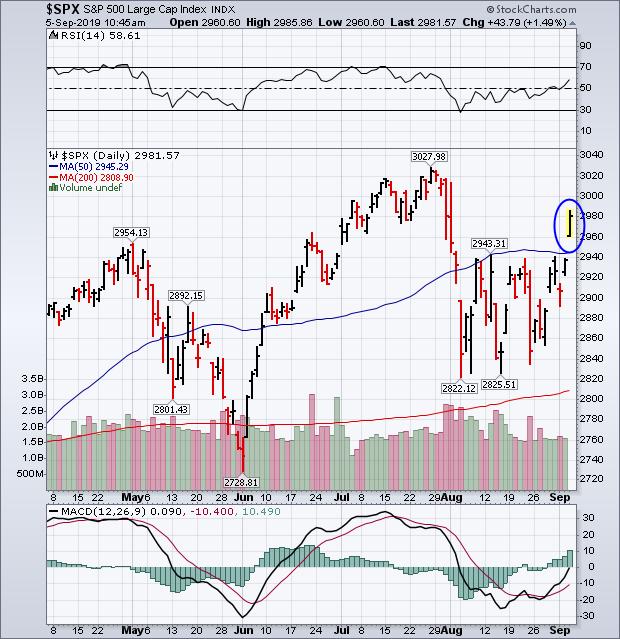
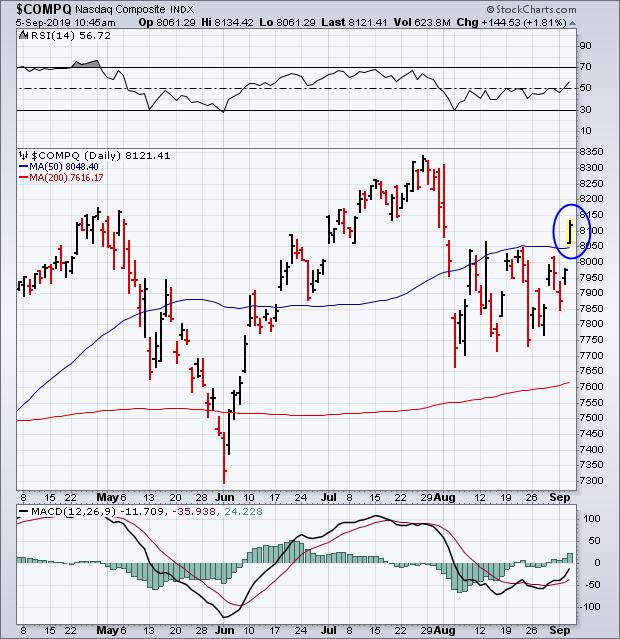
A rally in global stocks has taken a turn for the better with major stock indexes clearing some upside resistance barriers. The three major stock indexes shown below have all cleared their August highs and 50-day moving averages. At the same time, their 14-day RSI lines (upper boxes) have risen above 50; and their daily MACD lines (below charts) have turned more positive. That strong price action has pushed all three indexes out of their August trading ranges to the upside. Small caps and transports are also having a very strong day. Foreign stocks are rallying as well.
Eight of eleven U.S. sectors are in the black, and are being led higher by financials, technology, and industrials. Defensive sectors like staples, utilities, and real estate are in the red and lagging behind. A rebound in global bond yields is hurting bond proxies while boosting banks and other financial stocks. Semiconductors are leading technology stocks higher.
A pullback in the dollar over the last two days is helping to boost economically-sensitive copper and oil prices; while safe haven precious metals are seeing some profit-taking. After starting the week in risk-off mood, investors are taking a more risk-on attitude today as we near the end of the week. Some positive trade news and stronger economic data are behind today's more optimistic mood. But that can change very quickly. All we can do is follow the action on price charts which has turned more positive. While stocks are trading higher this morning, it's important that they hold onto those gains through the rest of the day.
Chart 1

Chart 2

Chart 3


