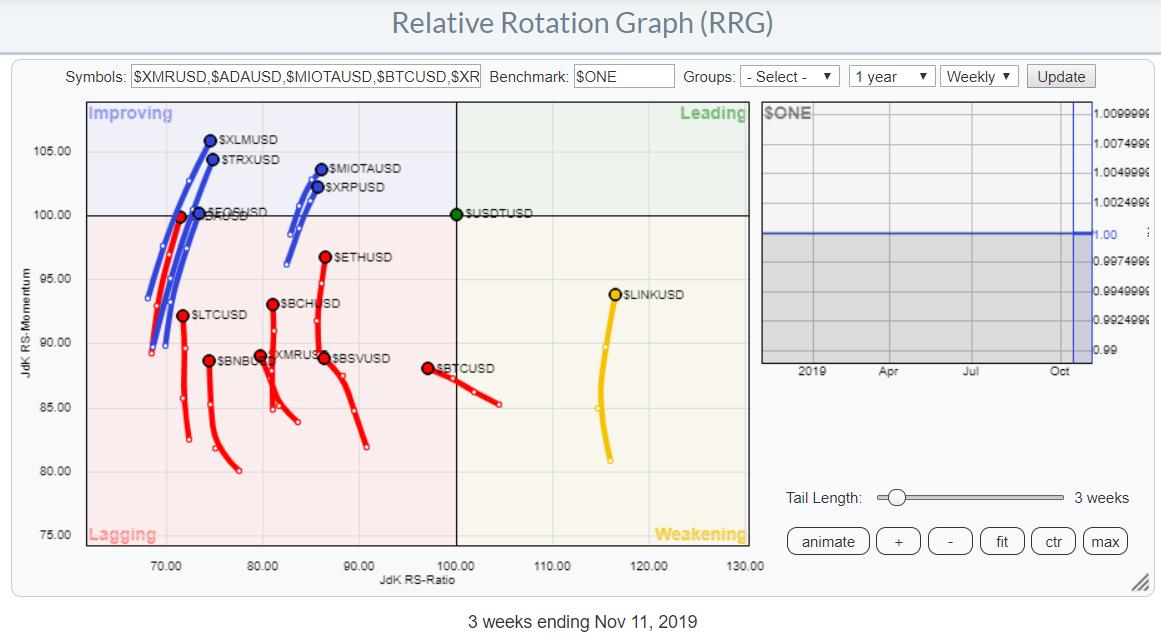
 Weekly RRG of cryptocurrencies vs. USD
On 8 November, StockCharts.com announced the arrival of cryptocurrency data in this ChartWatchers article. Regardless of what you think of cryptocurrencies, it's becoming increasingly hard to ignore them as the group of people that engage in trading them continues to grow.
Personally, I have no super-strong belief (yet) regarding the validity or sustainability of this emerging group of assets. I don't know if they already qualify as a new "asset class," but they do deserve our attention, at least every now and then.
What I do see/think is that cryptos are the almost perfect example of fear and greed, i.e. human emotions, at work in a trading environment.
Lacking any (real) fundamentals as we are used to from traditional companies, price is effectively the only thing that we can go by.
Cryptocurrencies are Perfectly Suited to Plot on RRG Charts
The fact that cryptocurrencies together make up a coherent group of assets makes them perfectly suitable for analysis using Relative Rotation Graphs.
Just like regular currencies, the "price of BTC" does not exist. The "price of the USD" also does not exist. Currencies are always expressed in another currency, and cryptocurrencies are no exception. Thus, we can talk about and look at charts of EUR/USD (the Euro expressed in USD) just as we can talk about and look at charts of BTC/USD (Bitcoin expressed in USD). We can also look at BTC/EUR or use any other currency as denominator, for that matter.
In technical terms, this means that currencies are already a relative (strength) line by themselves, one currency relative to the other.
You may have noticed that I have already written a few articles on how to use currencies on Relative Rotation Graphs. This article, written in 2016, explains how to use currencies on RRG charts.
With the arrival of crypto data, we can now go through the same setup as we have done for regular (fiat) currencies to plot them on Relative Rotation Graphs. At the moment, there are 15 different cryptocurrencies available on the site. The easiest way to find them is on Your Dashboard, located under the "crypto" tab in the "Market Overview" widget.
$ONE as the benchmark
The process to put cryptos on a Relative Rotation Graph is the same as for regular currencies: just put all the ticker symbols that you want to plot in the symbols box on the RRG page. As all tickers are expressed in USD, we need the benchmark symbol set to $ONE, as explained in the 2016 article. That setup will give you the RRG as shown at the top of this article.
You will notice that this universe is not as evenly spread out, as we usually see it when we graph sectors or stocks on an RRG. The reason for this is that these cryptocurrencies tend to move as a group vs. the USD. The only exception at the moment seems to be $LINKUSD, which makes it an interesting coin to look at individually.
Just like we can setup an RRG for the G10 currencies against the Euro, we can create an RRG for cryptocurrencies against BTC. As StockCharts only has the $###USD symbols available at the moment, we cannot setup a list with $###BTC tickers and use $ONE as the benchmark. Instead, we make $BTCUSD the benchmark symbol, giving us the RRG below:
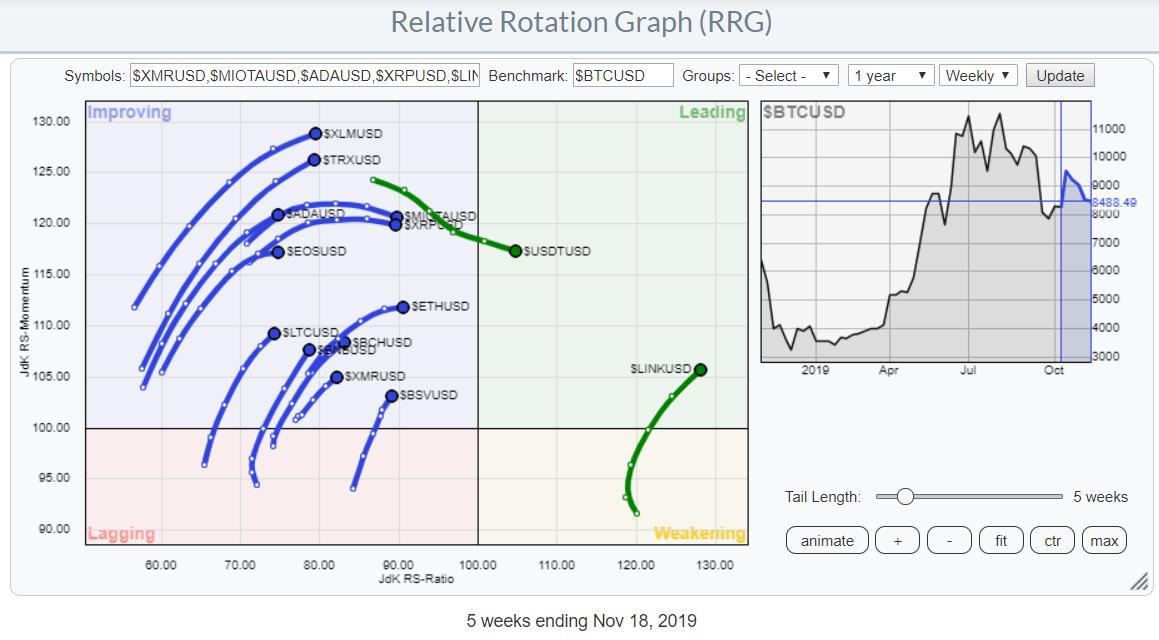 Weekly RRG of Cryptocurrencies vs. BTC
Cryptocurrencies Exhibit All the Characteristics of Normal (Traded) Securities
When you use the animation feature for RRGs on StockCharts.com, you will see that cryptocurrencies, just like regular currencies, sectors, stocks, etc., will exhibit a rotational pattern of moving in and out of favor around a benchmark.
Just like on regular RRGs, we can switch to a daily timeframe (see chart below) to see a more granular rotation for (crypto)currencies. The characteristics and interpretation remain the same.
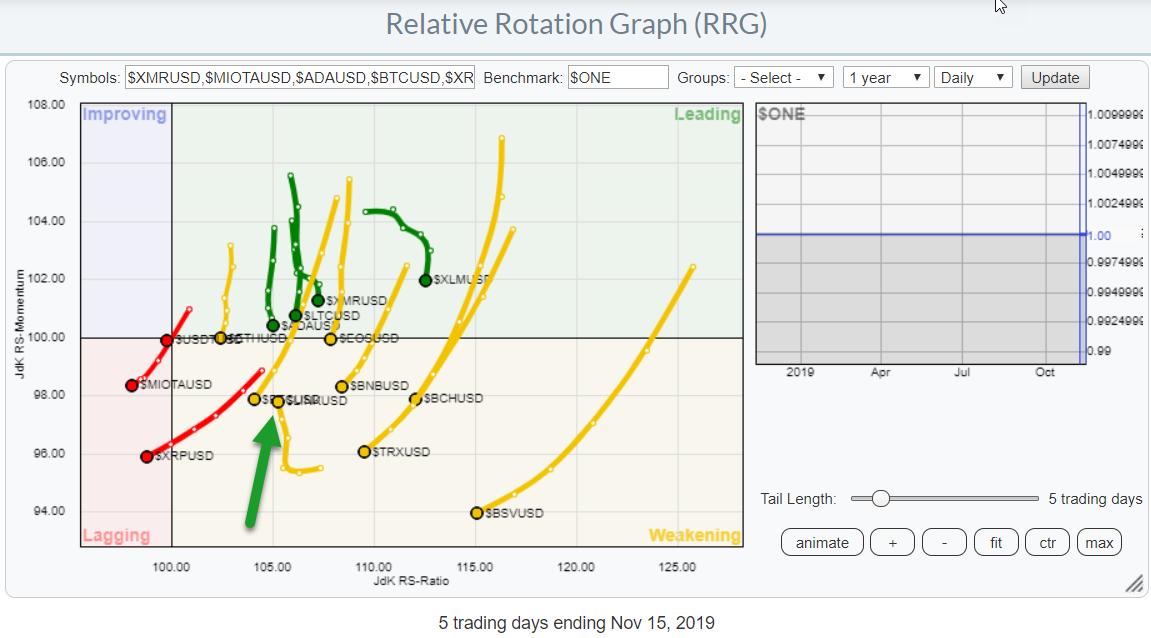 Daily RRG of Cryptocurrencies vs. USD
Chainlink - $LINKUSD
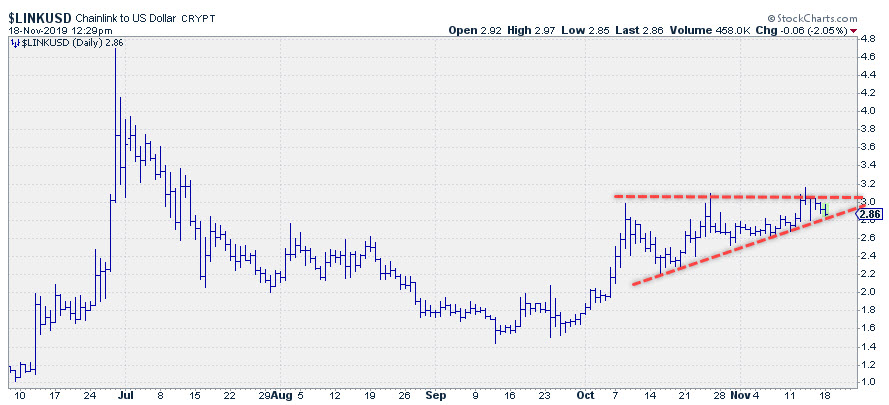 Daily chart of $LINKUSD
The Chainlink coin ($LINKUSD) already captured my attention on the weekly RRG, but it is also the only coin traveling against the pack on the daily RRG. LINK is inside weakening at the moment, but is already moving back up on the JdK RS-Momentum scale. This suggests a better performance for LINK over USD in the coming weeks.
Looking at the price chart, the overhead resistance in the area around $3.10 is providing resistance, but the lows since mid-October all came in at higher levels, suggesting that demand is strong and building up. Once the overhead supply around $3.10 can be cleared, much more upside potential is in the cards.
Note: Since this article was originally posted in the RRG blog earlier this week, $LINKUSD has dropped back below the rising trend line. This weakened the short-term outlook somewhat as that overhead resistance appears to be stronger than expected. In relative terms vs. USD and BTC, LINK remains one of the more interesting coins to watch for more upside.
-Julius
My regular blog is the RRG Charts blog. If you would like to receive a notification when a new article is published there, simply "Subscribe" with your email address.
Julius de Kempenaer
Senior Technical Analyst, StockCharts.com
Creator, Relative Rotation Graphs
Founder, RRG Research
Want to stay up to date with the latest market insights from Julius?
– Follow @RRGResearch on Twitter
– Like RRG Research on Facebook
– Follow RRG Research on LinkedIn
– Subscribe to the RRG Charts blog on StockCharts
Feedback, comments or questions are welcome at Juliusdk@stockcharts.com. I cannot promise to respond to each and every message, but I will certainly read them and, where reasonably possible, use the feedback and comments or answer questions.
To discuss RRG with me on S.C.A.N., tag me using the handle Julius_RRG.
RRG, Relative Rotation Graphs, JdK RS-Ratio, and JdK RS-Momentum are registered trademarks of RRG Research.
Julius de Kempenaer
Senior Technical Analyst, StockCharts.com
Creator, Relative Rotation Graphs
Founder, RRG Research
Host of: Sector Spotlight
Please find my handles for social media channels under the Bio below.
Feedback, comments or questions are welcome at Juliusdk@stockcharts.com. I cannot promise to respond to each and every message, but I will certainly read them and, where reasonably possible, use the feedback and comments or answer questions.
To discuss RRG with me on S.C.A.N., tag me using the handle Julius_RRG.
RRG, Relative Rotation Graphs, JdK RS-Ratio, and JdK RS-Momentum are registered trademarks of RRG Research.


