When the biotechs ($DJUSBT) get rolling, make sure to jump on board for the ride! The DJUSBT broke out above 600 at the beginning of 2012; by the time the run was over 3 1/2 years later, it had gained 167%! Since the middle of 2015, this same group of stocks has lost 8%. That's not good, especially when we consider that the S&P 500 has risen more than 40% over that same period. You should be able to imagine what that relative strength chart looks like for biotechs, but if you can't picture it, here you go:
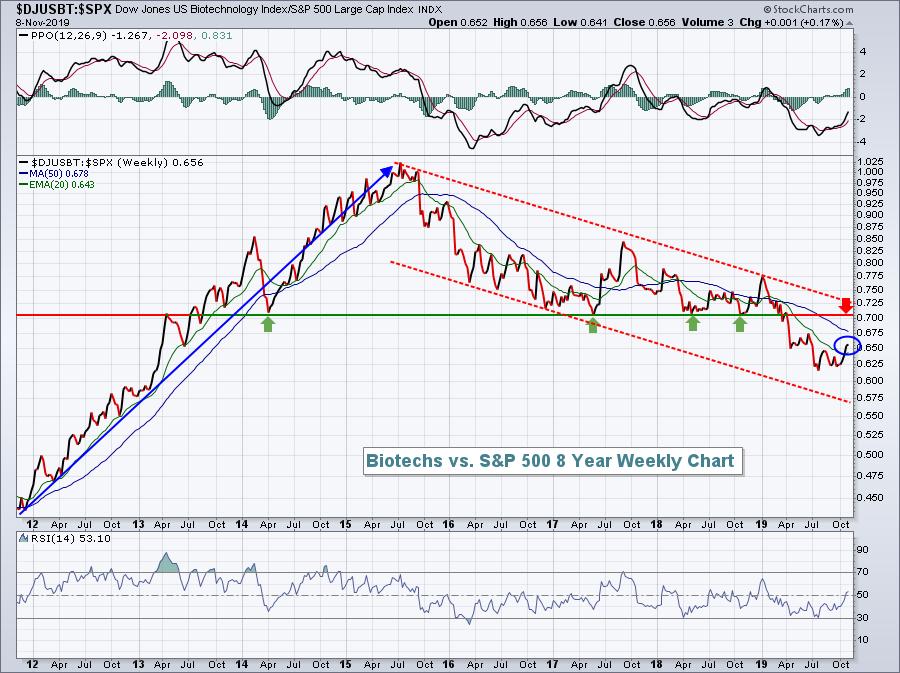
So the obvious bad news for the group is that the weekly relative downtrend remains firmly in play. However, there is a glimmer of short-term hope, in that the relative strength line has cleared the 20-week EMA for the first time in 10 months. Furthermore, if we shift to a price chart of the DJUSBT, you'll see a few positive developments:
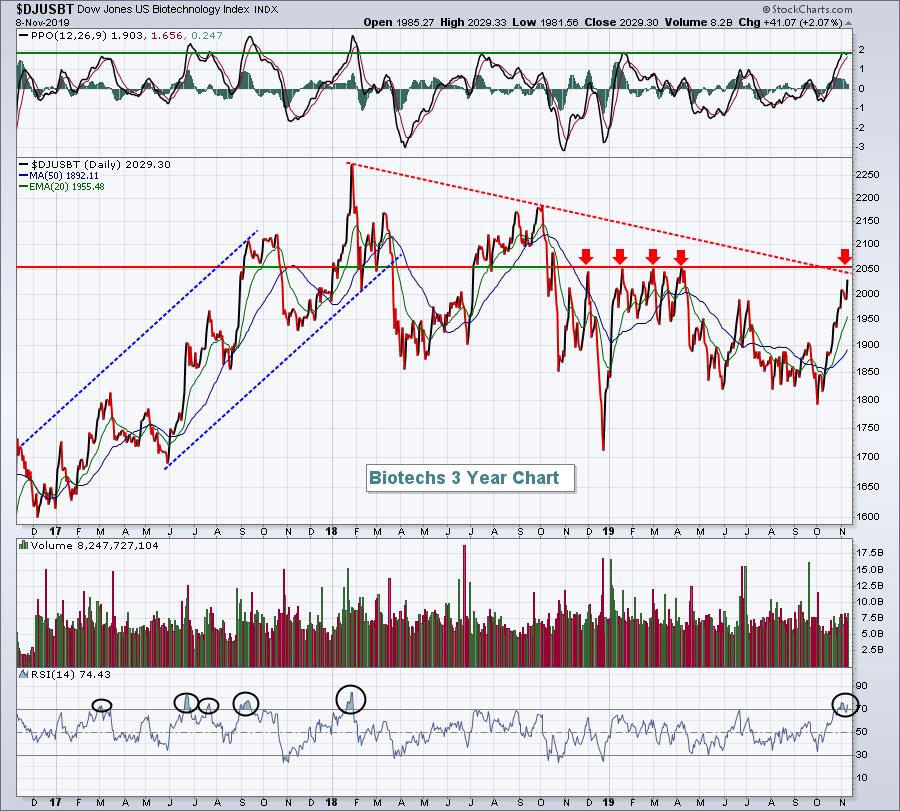
On this price chart, note that the RSI has moved above 70. That generally only happens during uptrends. If you look back over the last three years, you'll notice that when the RSI moves above 70, we tend to see more bullish action. During the current downtrend, we've not once seen the RSI move above 70 - not until now, that is. Also, the daily PPO has reached +2, which has been the top since early 2018. A PPO that rises above +2 would be a very bullish development, so watch for it. Next, look at where price and trend line resistance meet - at or near the 2050 level. If you see a price breakout above 2050, that, in my opinion, would be a confirming signal of a fresh uptrend.
Given this renewed strength (and assuming we see the breakout above), where should we consider trading in biotechs? Well, there are two ETFs that I'd consider, if ETFs are your thing: the SPDR S&P Biotech ETF (XBI) and the iShares NASDAQ Biotechnology ETF (IBB). The XBI is much more diversified, with the top holding (Seattle Genetics - SGEN) just 2.47% of the ETF value. The top 10 holdings represent 19.34% of the ETF value. The IBB, on the other hand, has been the much better performer, but its holding are much more concentrated; the top 10 holdings, for instance, represent 54.15% of the ETF value. IBB's top 3 holdings are Celgene Corp (CELG, 8.56%), Amgen Inc (AMGN, 7.84%) and Gilead Sciences (GILD, 7.69%), which comprise roughly 25% of the entire ETF. So you need to know what you're buying.
My preference between these two ETFs would be the IBB. I love the CELG and AMGN charts, and the fourth largest holding, Vertex Pharmaceuticals (VRTX), just broke out to an all-time high here in the past 1-2 weeks. To compare their performances, let's look at IBB:XBI on a relative chart:
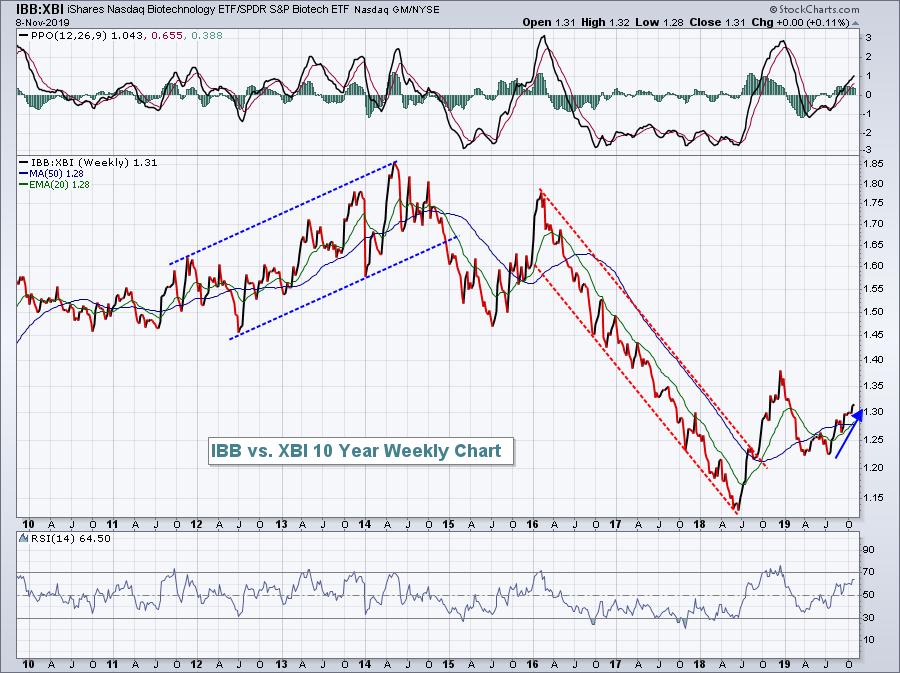
One thing that's very clear to me is that owning the IBB vs. the XBI is a big deal. They go through periods of outperformance and underperformance, and I'd tend to stick with the one that's leading... until it isn't. So I prefer the IBB at this point.
From an individual stock standpoint, there are two large cap biotech names that I like right now. The first is Amgen (AMGN):
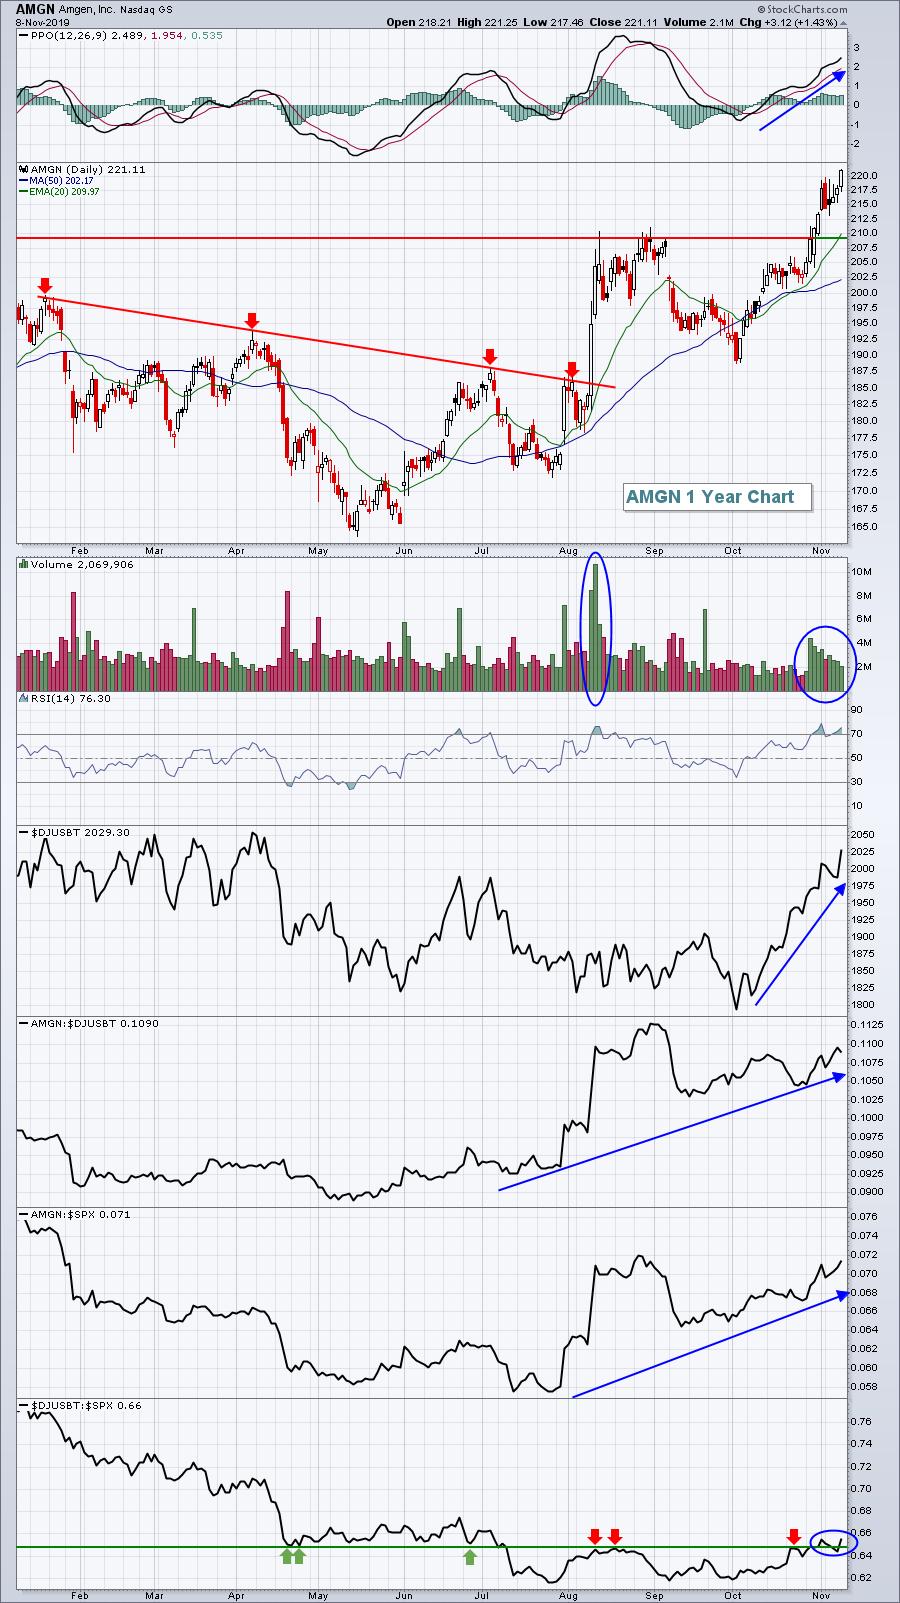
AMGN is a leader and thus isn't subject to the massive selloffs when a drug trial fails. I see higher prices ahead for AMGN.
The second stock I'd like to discuss is Regeneron Pharmaceuticals (REGN). On Wednesday, in my Trading Places LIVE show, I covered REGN as my #1 stock in the "3 You Must See" segment that I end each show with. The stock has been consolidating for the past four years following a dizzying rally from 20 bucks in 2010 to 600 in 2015!!! That was a 30-bagger! It's taken a while for the stock to break back to the upside, but I think it's happening right before our eyes. Look at the recent transition from downtrend to uptrend:
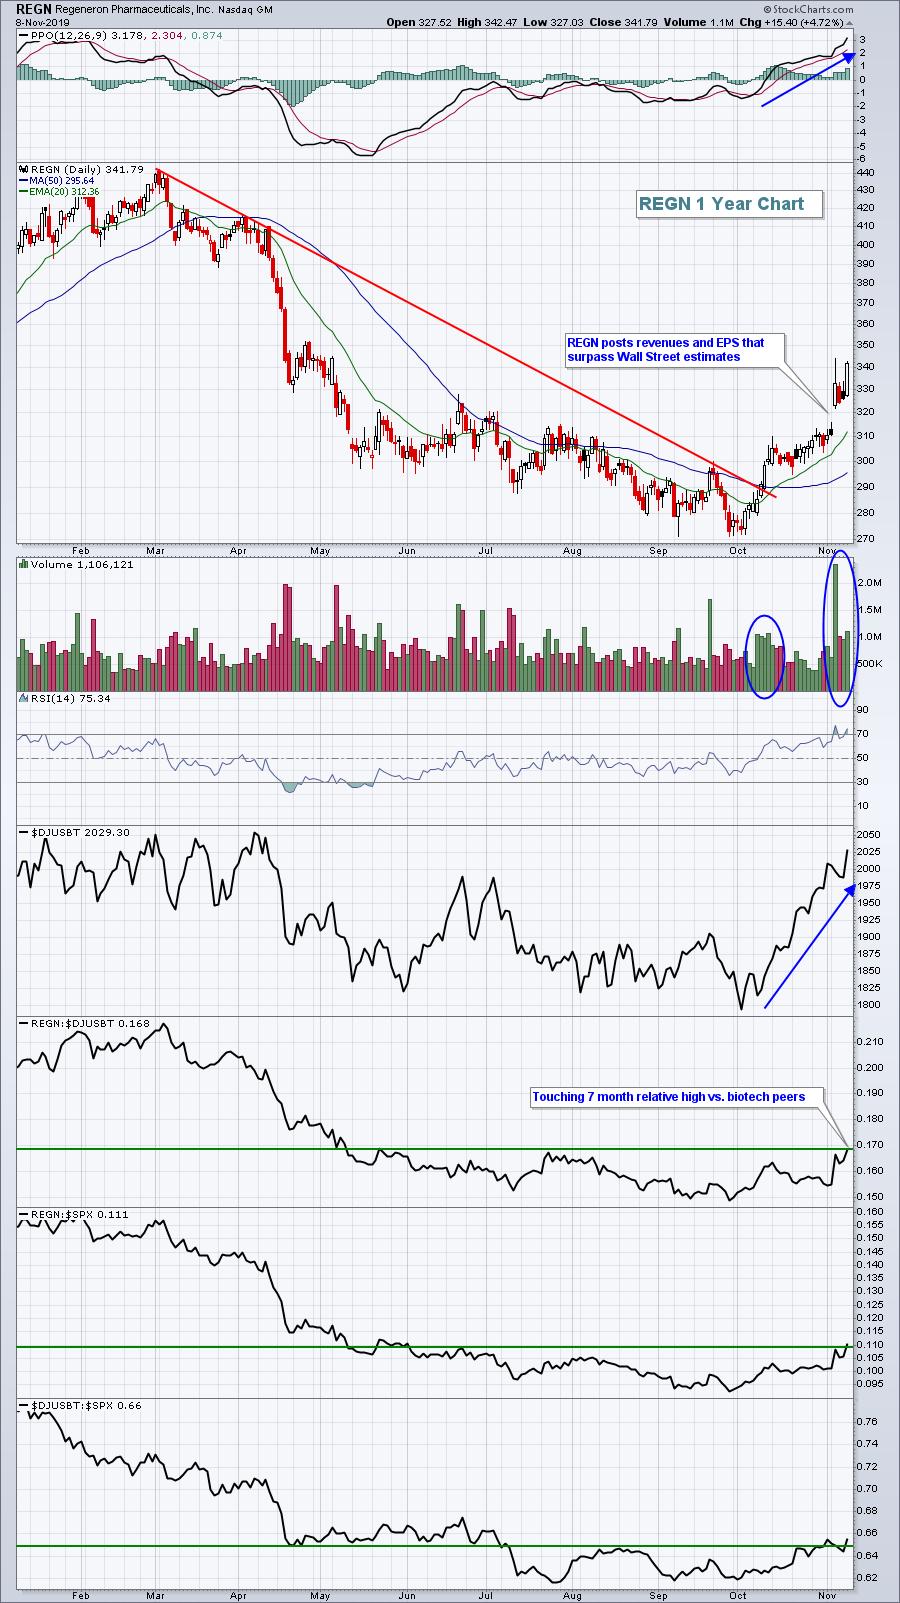
I expect to see higher prices from REGN in the balance of 2019 and into 2020. Volume trends are much more bullish now and, unlike AMGN, REGN seems to just be starting its uptrend. It's also just moved up to test its 7-month relative high (vs. the DJUSBT). On Friday, REGN was the top-performing stock in the S&P 500.
On Monday, November 11th at 4:30pm, I'll be hosting a "Top 10 Stocks Sneak Preview" webinar, where I release my Top 10 stocks for each of my Model, Aggressive and Income portfolios on Tuesday, November 19th. Here are how my portfolios have performed vs. the benchmark S&P 500:
Model Portfolio (since inception on 11/19/18 and through 11/8/19): +39.66%
S&P 500 since 11/19/18: +14.95%
Aggressive Portfolio (since inception on 5/19/19 and through 11/8/19): +9.28%
Income Portfolio (since inception on 5/19/19 and through 11/8/19): +9.95%
S&P 500 since 5/19/19: +8.17%
All 3 portfolios, despite a difficult past 10 weeks during the market's rotation from growth stocks to value stocks, have outperformed the benchmark S&P 500 since their respective inceptions. At Monday's webinar, I'll be discussing my methodology for selecting stocks for each portfolio and will even share a few excellent recent earnings reports of companies that might just find themselves in one of my portfolios come November 19th.
This Monday event is free to everyone and I encourage you to attend. I'll be discussing recent rotation to areas like biotechs and transports ($TRAN), providing potential trading opportunities there and in other areas of the market. All I ask is that you sign up for our free EB Digest newsletter and become a part of our rapidly growing EarningsBeats.com community. Furthermore, my Monday EB Digest article will feature my favorite mid-cap biotech stock, one that could be poised to explode if money continues rotating into the group.
CLICK HERE to sign up for the free EB Digest newsletter, receive the mid-cap biotech stock Monday morning, and reserve your seat for our very popular Monday event!
Happy trading!
Tom


