 The character of the stock market changed over the last six to seven weeks as the market took on a more offensive tone. Don't get me wrong. The stock market was already in bull mode and the S&P 500 has been above its 200-day SMA since early June. The bull market simply broadened and turned more offensive, which is positive.
After a surge in the first quarter of 2019, the middle six months turned very selective as large-caps worked their way higher and small-caps edged lower. The S&P 500 SPDR and Nasdaq 100 ETF gained around 5% from April to September, while the Russell 2000 ETF fell 2.4% and the S&P SmallCap 600 SPDR fell .40%. This mixed environment made it tough for traders and investors.
Market character changed over the last six weeks as the Russell 2000 ETF surged and actually performed in line with the S&P 500 SPDR. Both are up around 5% the last seven weeks. Even though IWM is not "outperforming", small-caps are getting their mojo back and it looks like the bull market is broadening. In addition to the resurgence in small-caps, I would like to highlight three more signs of a broadening bull market.
Stocks outperforming Bonds
Not only is SPY hitting a new high and in a long-term uptrend, but it is also outperforming the 20+ Yr Treasury Bond ETF (TLT) again. Stocks represent risk assets and bonds represent safe-haven assets. The market embraces risk when stocks outperform and turns risk-averse when bonds outperform.
The chart below shows SPY hitting new highs in October and trading well above its rising 50-day SMA. In contrast, TLT formed a lower high in early October and exceeded its September low earlier this month. TLT is also below its falling 50-day SMA. Money is moving out of safe-haven bonds.
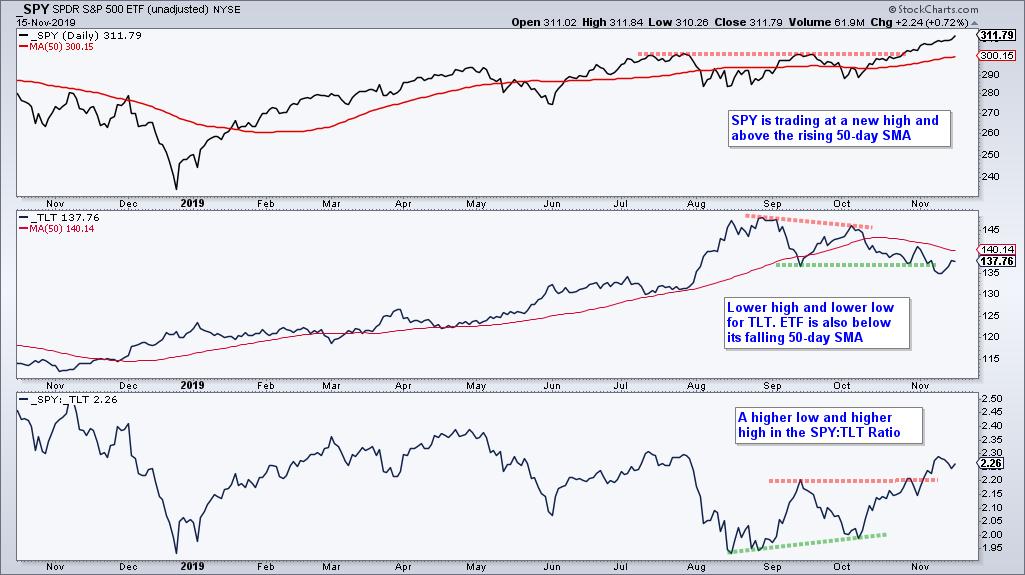
The bottom window shows SPY relative to TLT using a ratio chart (_SPY:_TLT). This risk ratio formed a higher low from August to October and broke above its September high. Risk is clearly "on" because riskier assets (stocks) are outperforming safe-haven assets (Treasury bonds).
High Beta Outperforming Low Volatility
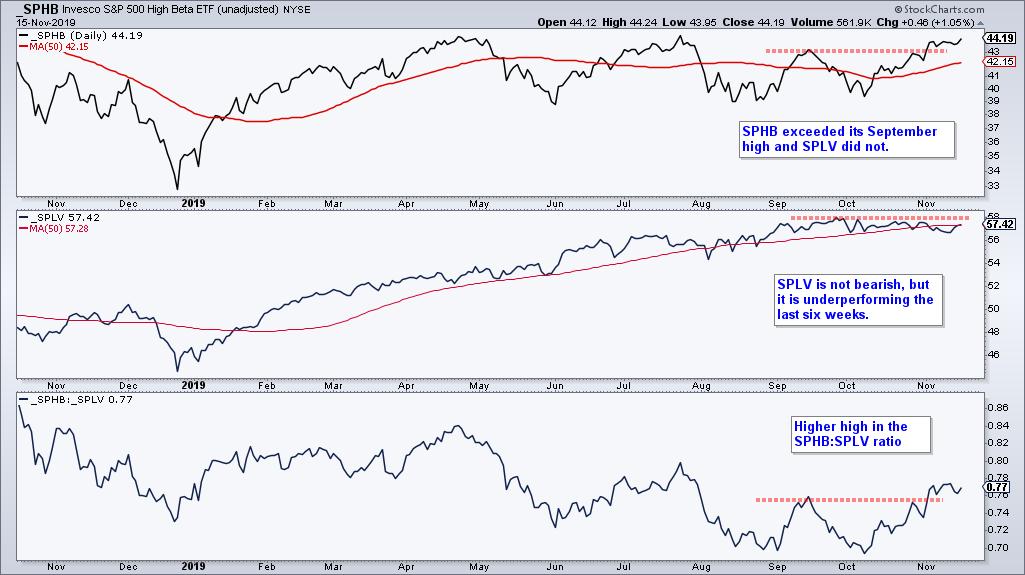
The next chart confirms what we are seeing with SPY and TLT. The S&P High Beta ETF (SPHB) is starting to outperform the S&P Low Volatility ETF (SPLV). The top window shows SPHB breaking above its September high and the middle window shows SPLV just below its September high. SPLV did not fall much over the last six weeks, but it clearly did not partake in the stock market rally. This relative weakness is confirmed when we look at the SPHB:SPLV ratio. This risk ratio exceeded its September high and the higher high means SPHB is outperforming SPLV (or SPLV is underperforming SPHB). Either way you slice it, risk is "on" when high beta stocks outperform low volatility stocks.
Offensive Sectors Outperforming Defensive Sectors
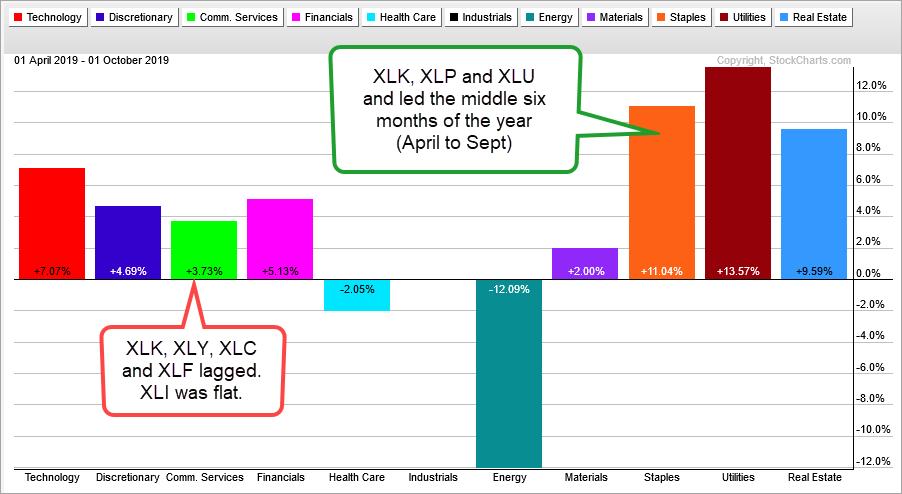
There has been a clear shift away from the defensive sectors over the last six weeks. The first PerfChart shows performance for the eleven sector SPDRs from April to September. Utilities, Consumer Staples, and Real Estate led the middle six months with big gains. In contrast, Technology, Consumer Discretinary and Finance lagged with smaller gains. Industrials actually fell a fraction.
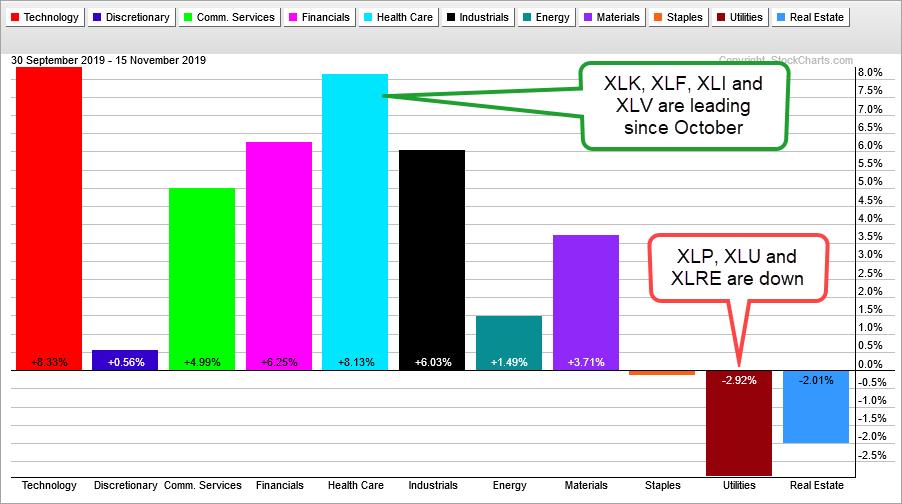
Fast forward to the last six weeks and a different picture emerges. Technology, Finance, Industrials and Healthcare are leading with the biggest gains Three of these sectors are offensive sectors and the Healthcare is the second biggest sector in the S&p 500. Together, these four account for 59% of the S&P 500. In contrast, money moved out of Utilities, Consumer Staples and Real Estate because they are down. These defensive sectors are underperforming.
The bull market never went away in the middle six months. It just took a breather, which is natural after the sharp advance in the first quarter. The corrective period in the middle six months of the year appears to be ending now as the market takes on a more offensive tone. Looking for ETFs or stocks poised to break out and lead into yearend? Check out TrendInvestorPro.com, home of objective, systematic and sober analysis from Arthur Hill, CMT.
Geared towards the weekend trader or investor, TrendInvestorPro offers:
- Systematic ETF rankings and analysis (Thursdays)
- ChartBook with annotated charts for 60 core ETFs (Thursdays)
- Market timing models and broad market commentary (Fridays)
- Stock setups and chart analysis (Saturdays)
- Weekly video analysis and commentary (Saturdays)
Subscribe today for immediate access!
----------------------------------------------------------------------------------------------------------
Choose a Strategy, Develop a Plan and Follow a Process
Arthur Hill, CMT
Chief Technical Strategist, TrendInvestorPro.com
Author, Define the Trend and Trade the Trend
Want to stay up to date with Arthur's latest market insights?
– Follow @ArthurHill on Twitter


