
Black Friday weekend is here and the holiday shopping season is just getting started. While I have no clue which retailers will be the big winners or losers this season, the mobile payments industry is likely to be a big winner. Mobile payments are expected to exceed $300 billion this year and $400 billion next year (Source: BI Intelligence).
Sounds like a high-growth industry that could use an ETF. And there just happens to be one: the Mobile Payments ETF (IPAY). IPAY debuted in July 2015 at 24.95, dipped below 20 in February 2017 and then went on a tear. The ETF exceeded 40 in September 2018 and touched 50 in July 2019. IPAY is currently trading around 49 and has pretty much double since its debut.
Now let's put industry fundamentals, or biases, aside and look at the price chart. IPAY looks bullish because it just ended a corrective phase and broke out to signal a resumption of its bigger uptrend. The chart below shows the ETF hitting new highs in July and then correcting back to the rising 40-week SMA in September-October. Notice that this decline retraced around two thirds (66.67%) of the prior move and returned to broken resistance, which turned support. This looks like a classic two steps forward and one step backward sequence with another step forward beginning.
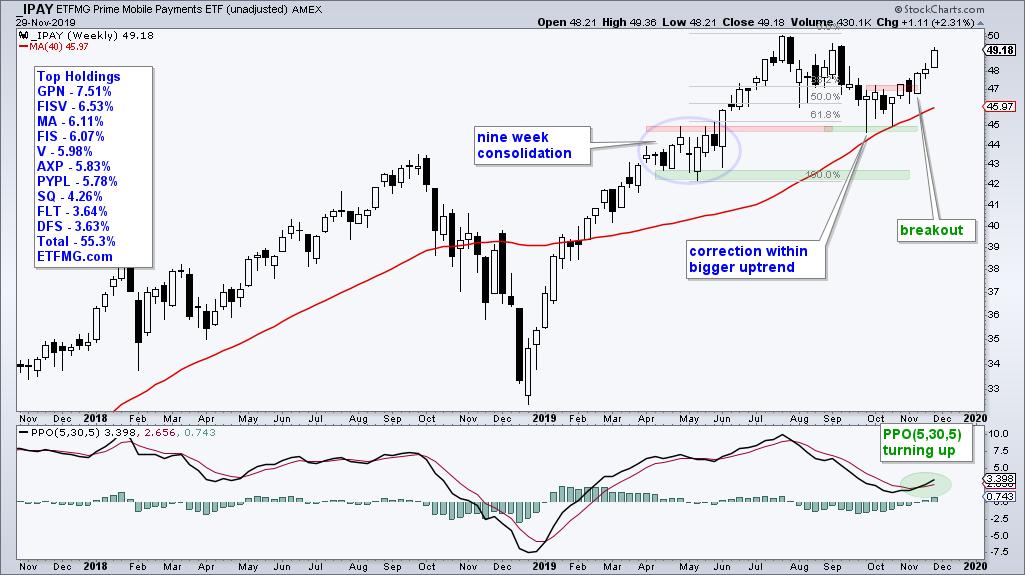
IPAY firmed above the rising 40-week SMA for four weeks and then broke out in mid November (3 weeks ago). The breakout signals an end to the correction and a resumption of the bigger uptrend. As such, I would expect a move above the July high in the coming weeks. The indicator window confirms the upturn as the PPO(5,30,5) turned up and moved above its signal line the last two weeks. 'Tis the season for momentum in mobile payments!
Special Offer for StockCharts members!
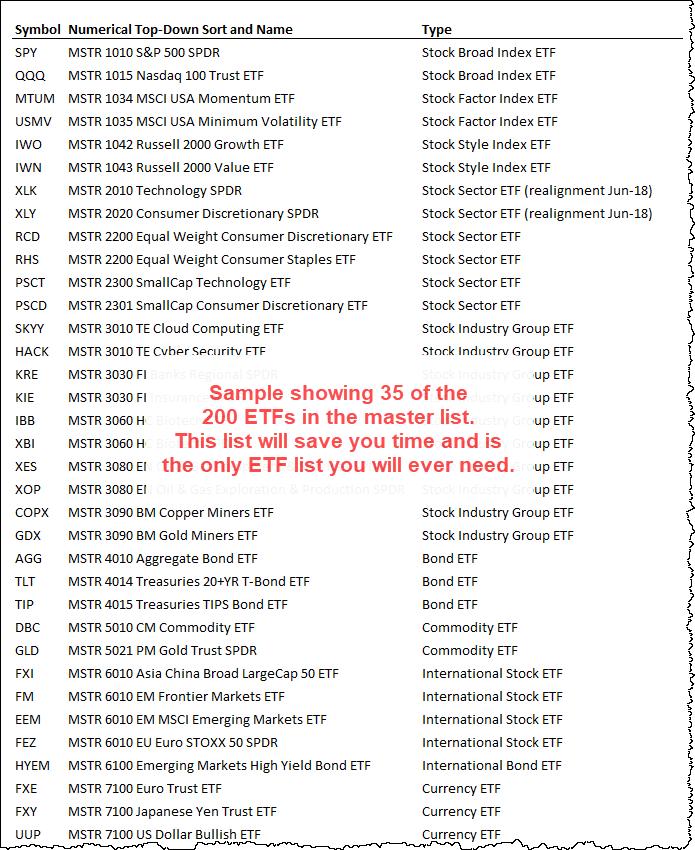
Tired of wading through 1000s of ETFs? Let TrendInvestorPro.com do the work for you with a comprehensive and focused list of carefully chosen ETFs. In addition, these ETFs are organized with numerical prefixes that make it easy to follow a top-down analysis process with just one ChartList. Subscribe to TrendInvestorPro with the email you used to sign-up or log-in to StockCharts and I will share this ChartList.
The master list includes: 8 Broad Index ETFs, 6 Factor ETFs, 8 Style ETFs, 31 Sector ETFs, 51 Industry Group ETFs, 17 Fixed Income ETFs, 6 Commodity ETFs, 54 International ETFs, 11 Currency ETFs and a few others. The core list refines this master list by filtering out ETFs with low volume and reducing redundancy.
Note that you must be an Extra or Pro member of StockCharts to have more than one ChartList. Sign up with the email you used to sign-up or login to StockCharts and I will share the ChartList to that email. Those who are not StockCharts members can receive a CSV file and upload the list to their preferred charting platform.
Click here to take your analysis to the next level!
-----------------------------------------------------------------------------------------------------------
Choose a Strategy, Develop a Plan and Follow a Process
Arthur Hill, CMT
Chief Technical Strategist, TrendInvestorPro.com
Author, Define the Trend and Trade the Trend
Want to stay up to date with Arthur's latest market insights?
– Follow @ArthurHill on Twitter


