 2019 was a year with lots of distractions, and yet the S&P 500 recorded 52-week highs in six of the last nine months. The index surged 17.7% the first four months and recorded its first 52-week high in late April. It then finished strong with a new high in late December and is currently around 10% above its April high. Distractions were prevalent throughout these new highs as we heard about the tariff battle, the inverted yield curve and relative weakness in small-caps, among other things.
These distractions did not derail the bull market and there were plenty of names that moved higher from May to December. In fact, 93 stocks in the S&P 500 are up more than 20 percent since May, while another 144 are up between 10 and 20 percent (sans dividends). This means around half the components in the S&P 500 are up 10% or more from May to December. Obviously, the year-to-date numbers would include the January to April surge and look even better.
The chart below shows three examples with these distractions, which are nothing more than bear bait. The US-China tariff thing has been on and off all year, but interest in the search term "tariff" peaked in May (source: Google Trends). The S&P 500 was already up 17.7% at the end of April and declined as the tariff battle heated up. A chartist focused solely on price and unaware of the distractions would likely see a normal pullback after a 17.7% surge. In fact, a picture-perfect falling flag formed and the index broke out in early June.
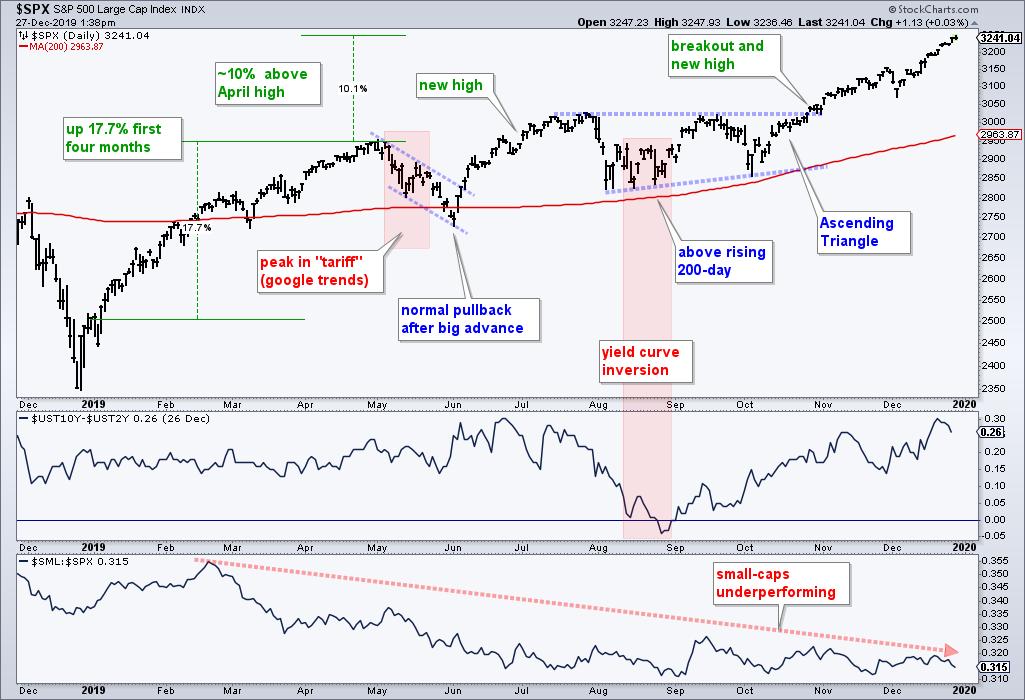
The yield curve distraction surfaced in August as the 10-year Treasury yield moved below the 3-Month Treasury Yield in early August and below the 2-year Treasury yield in late August. This might be important if you are trading bonds, but it was just a distraction for the stock market. The S&P 500 fell sharply for a few days in early August, but then firmed above its early June low and above its rising 200-day SMA. The uptrend was never in jeopardy because there was a higher high in July and a higher low in August. The S&P 500 then went on to new highs as the Finance SPDR (XLF) caught fire and also moved to new highs.
And last, but not least, small-caps have pretty much underperformed all year long. The price relative ($SML:$SPX) hit a new low in early September and bounced around this low in October, November and December. Guess what? Relative weakness in small-caps did not derail the S&P 500. Even at its lowest point (May 31st), the S&P SmallCap 600 was still up around 5% year-to-date. Moreover, $SML is up over 20% year-to-date, which is not exactly weak. Small-caps are underperforming and the price relative is moving lower because $SPX is up over 30% year-to-date. Perhaps relative weakness in small-caps have more to do with relative strength in large-caps.
So what's the moral of the story here? Forget the wall of worry in 2020 and focus on what really matters: price action. The S&P 500 was strong throughout 2019 and the cup was half full pretty much all year. This meant there were plenty of bullish setups to be had and we needed a bullish mindset to take advantage. If small-caps are lagging, then avoid small-caps. But don't throw out the baby with the bath water. If the S&P 500 is bullish and leading, then trade accordingly by looking for bullish setups within the S&P 500 and expecting bullish resolutions.
Price isn't everything, it's the only thing!
Looking for more Themes in 2020?
Join myself, John Murphy and seven other top analysts from StockCharts for MarketVision 2020. Pre-registration is free and entitles you to a discount as well as access to the weekly webinars (recordings) leading up to the main event, which is January 4th. Click here to register for free!

----------------------------------------------------------
Last weekend at TrendInvestorPro.com, I featured eight stocks with long-term uptrends and bullish themes as we head into 2020. In addition, I also covered the current uptrend in the S&P 500. It is strong, but has yet to get parabolic. I then showed three indicators to watch as we head into January. Subscribe today and get immediate access to these reports and the weekend video.
----------------------------------------------------------
Choose a Strategy, Develop a Plan and Follow a Process
Arthur Hill, CMT
Chief Technical Strategist, TrendInvestorPro.com
Author, Define the Trend and Trade the Trend
Want to stay up to date with Arthur's latest market insights?
– Follow @ArthurHill on Twitter


