
Periodically, I'd like to look at some of my previous "DP Diamond" selections and show you some successes (darlings) and failures (duds). They don't all do what they should, after all. I have to say though, I find far more "darlings" in my Diamonds than "duds" as I went back to look at some of the diamonds in the rough I presented about a month ago. I'll start with two "duds" and follow up with two "darlings."
DUD: Enbridge Inc (ENB) - Earnings: N/A
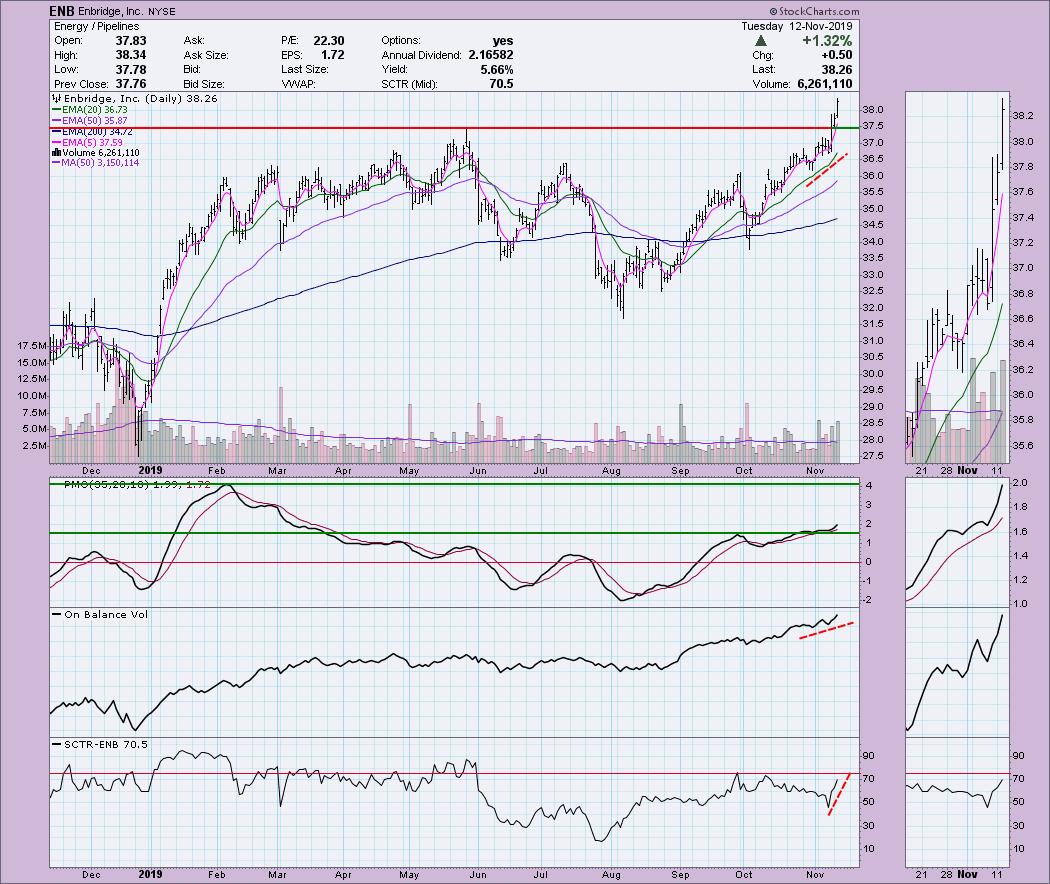
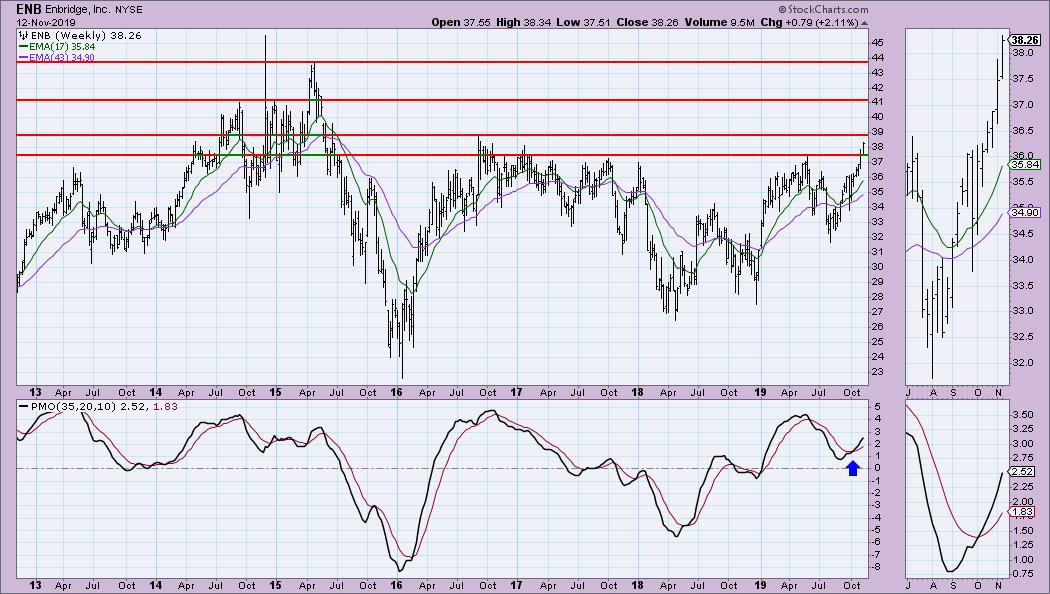
THEN: Below are the original charts that I annotated on November 12th. We had a great set-up on the indicators; the only issue I had was that it had rallied high enough that I thought we might see a pullback. On the weekly chart, I expressed concern that there was overhead resistance arriving, but overall upside potential was high should it break out.
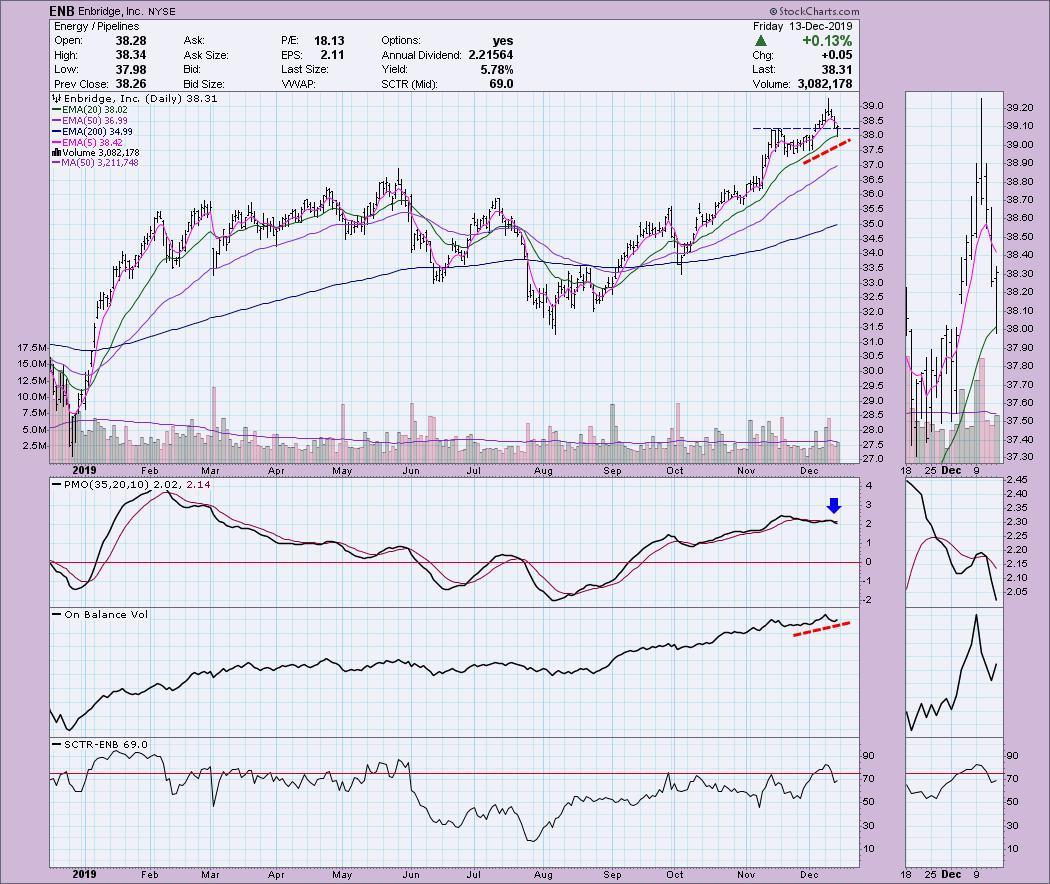
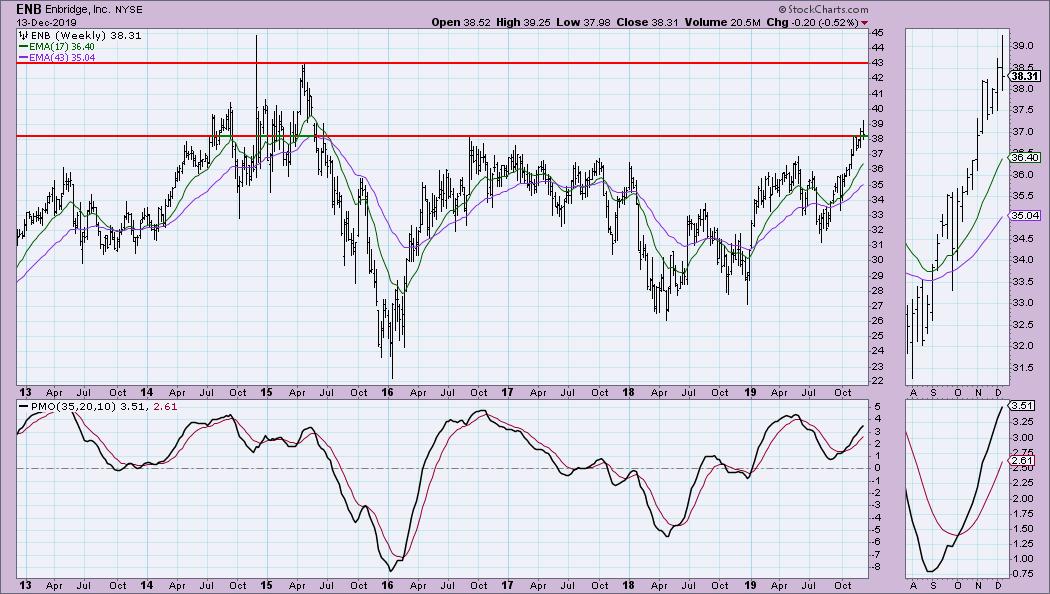
NOW: Right now, you'd be at a small gain had you bought on 11/13, but overall it hasn't done much. The daily chart has problems, mainly with the Price Momentum Oscillator (PMO), which is in decline. Overall, OBV volume is still suggesting more upside, and there is potential for it to bounce off the 20-EMA, but, given the daily PMO, I'm not confident. The weekly chart is still favorable.
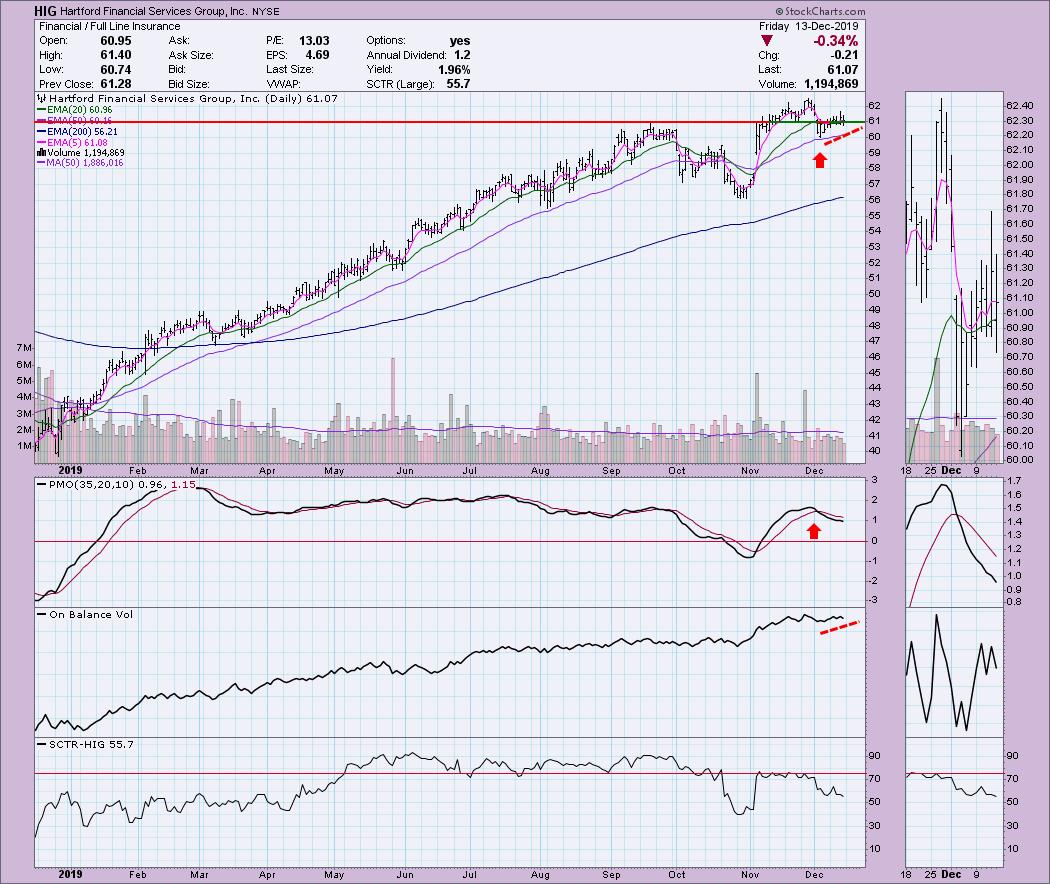
DUD: Hartford Financial Services Group, Inc. (HIG) - Earnings: 2/3 - 2/7/2020
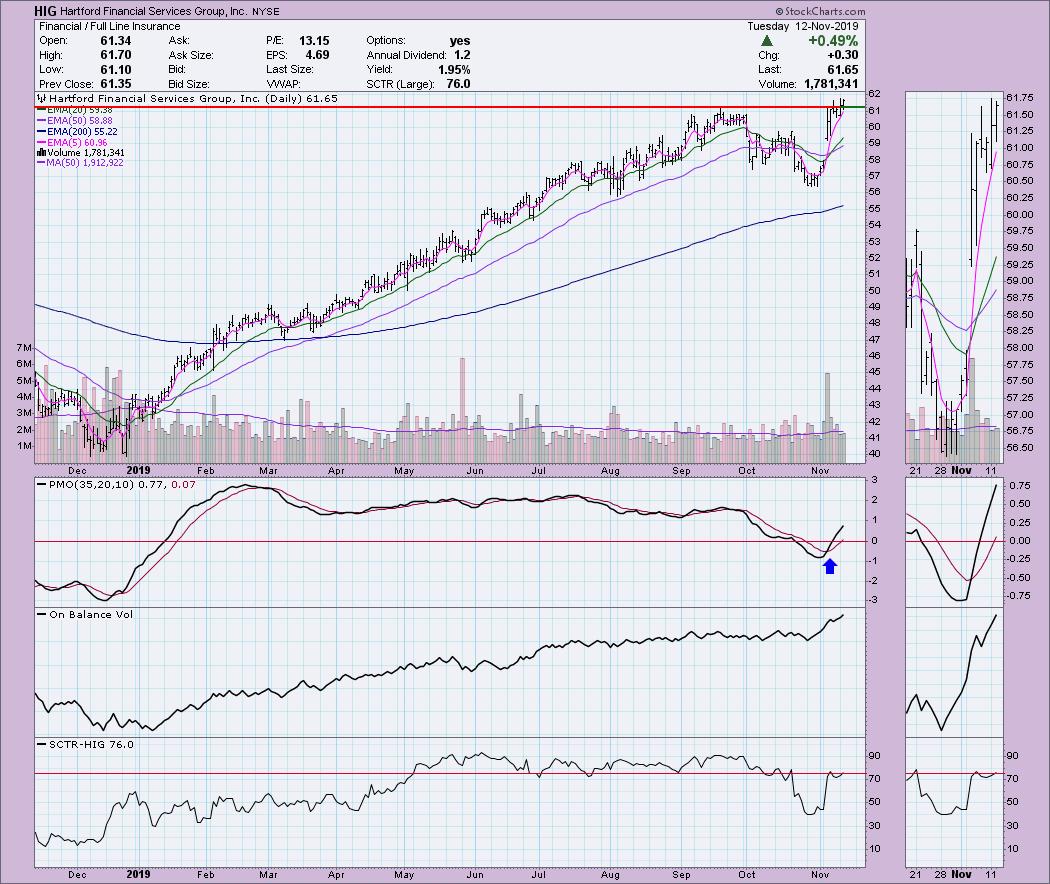
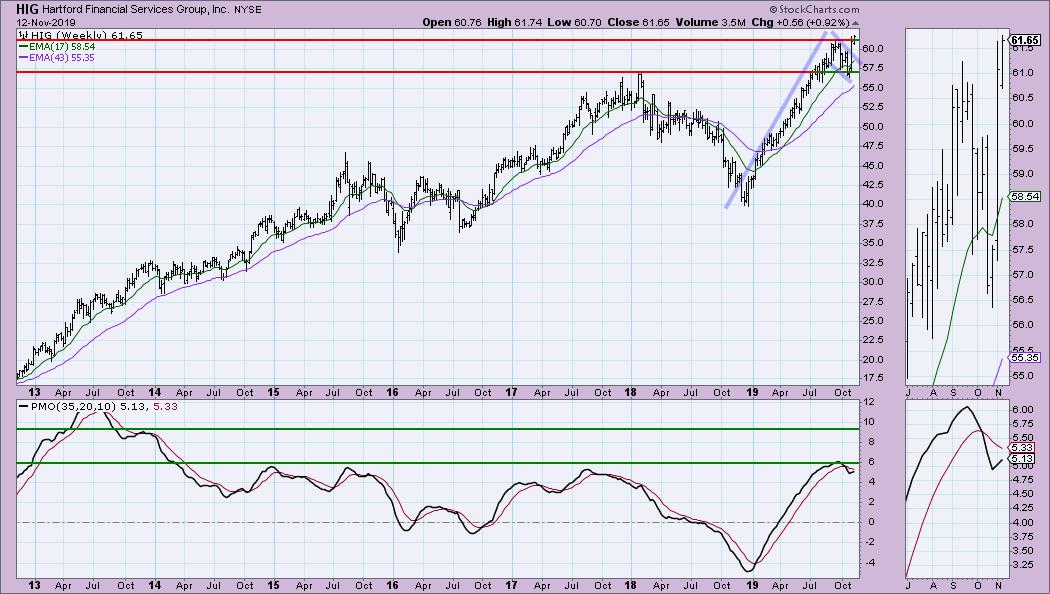
THEN: The breakout on HIG, combined with the PMO BUY signal on 11/12, are the bullish characteristics I pointed out. Volume was also coming in. On the weekly chart, I saw a long-term flag that had executed with this breakout.
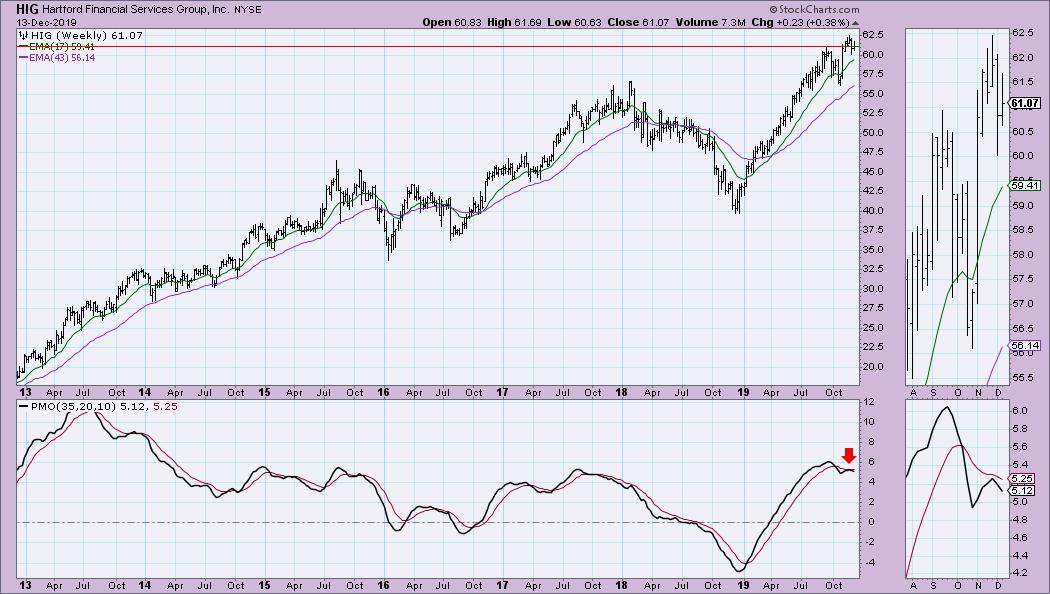
NOW: Looking at the daily chart today, we can see that the BUY signal failed to hold and, while price did rise in the short-term, if you had been holding it since then, you be down about $0.60. I think it could rally, but overall the daily and weekly charts have turned quite bearish.
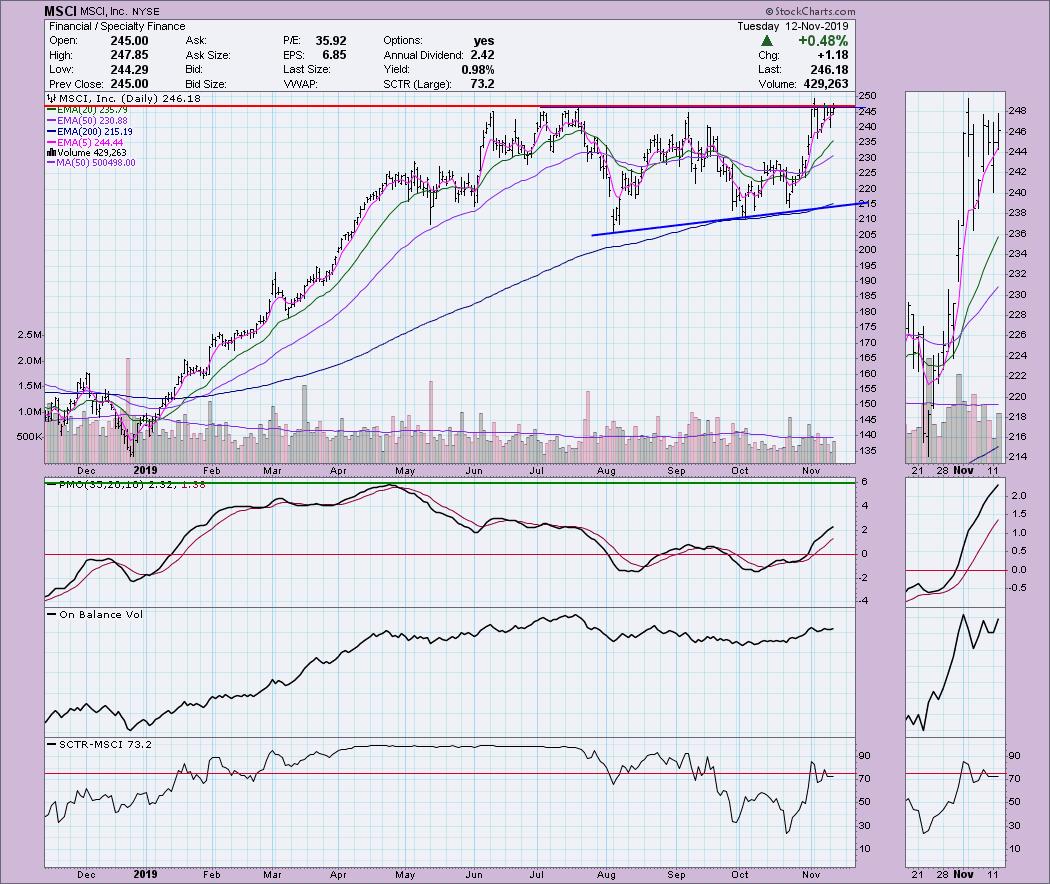
DARLING: MSCI Inc (MSCI) - Earnings: 1/29 - 2/3/2020
THEN: I was looking at the ascending wedge to execute and drive prices higher. The PMO was not overbought and the weekly chart was promising. It was at $246.18 and today it is at $260.09.
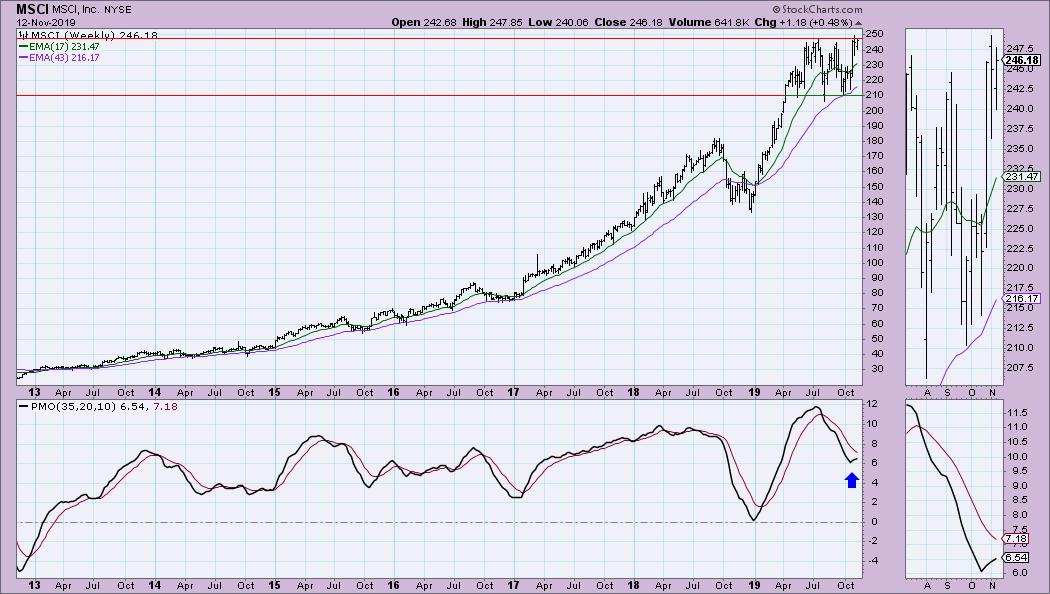
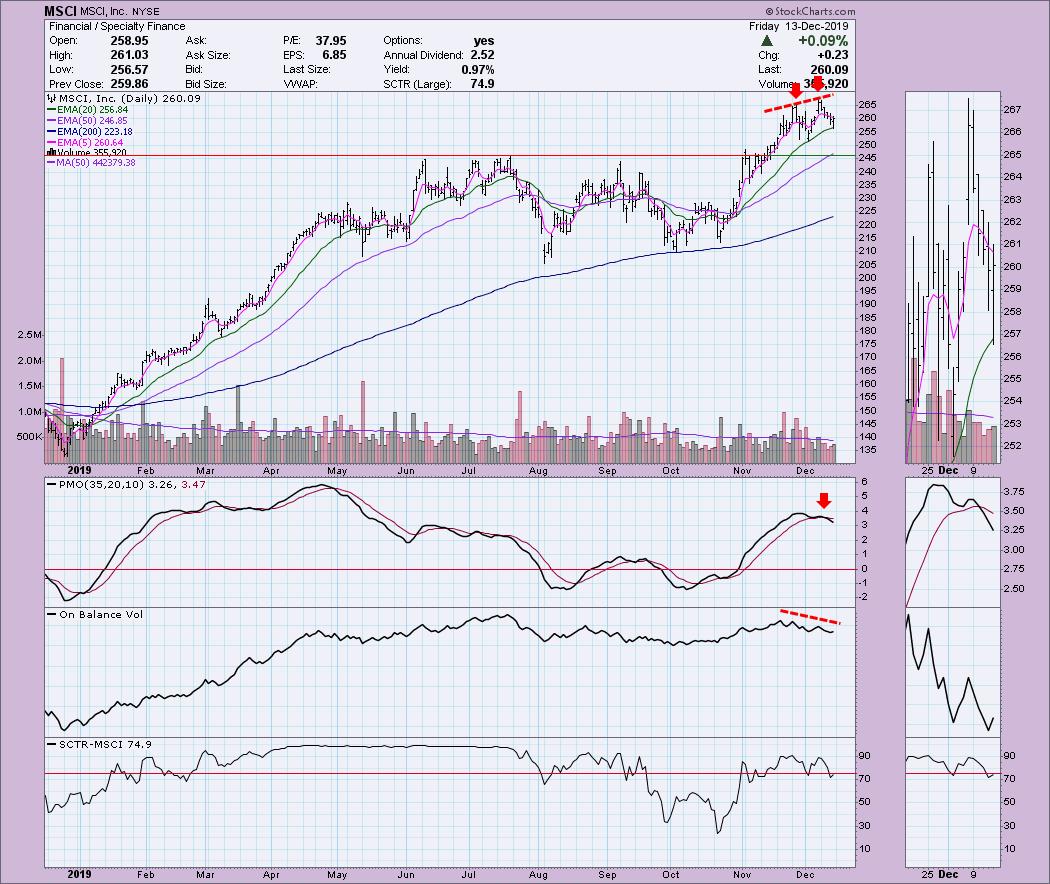
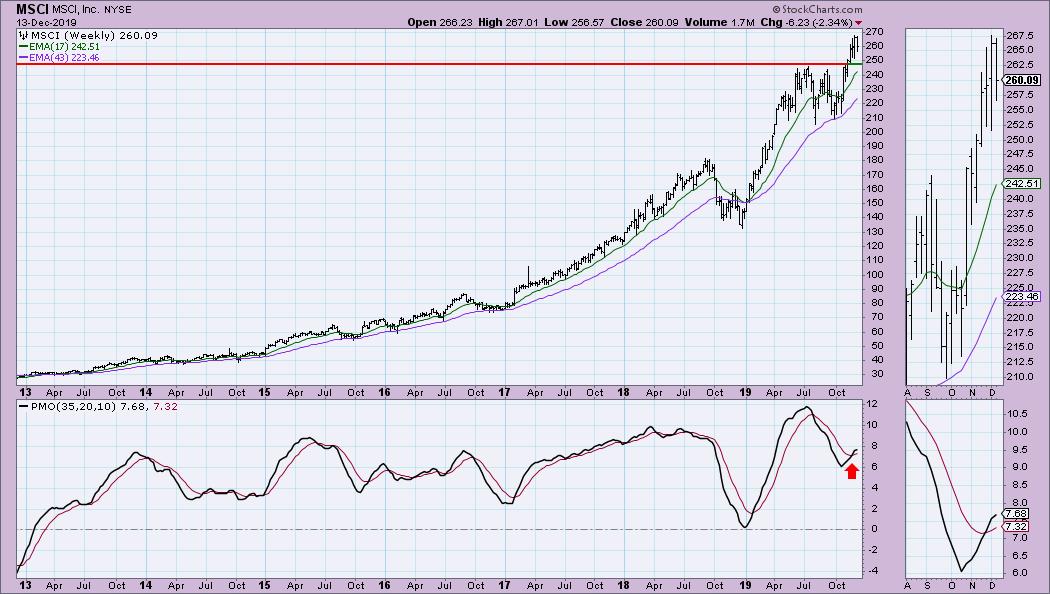
NOW: In the short term, this one is likely in for a retest of support at the summer highs. Based on the weekly chart, however, I believe this will continue to rise overall given the weekly PMO. It may not be quite time to enter if you haven't already.
DARLING: Globus Medical Inc (GMED) - Earnings: 11/6/2019
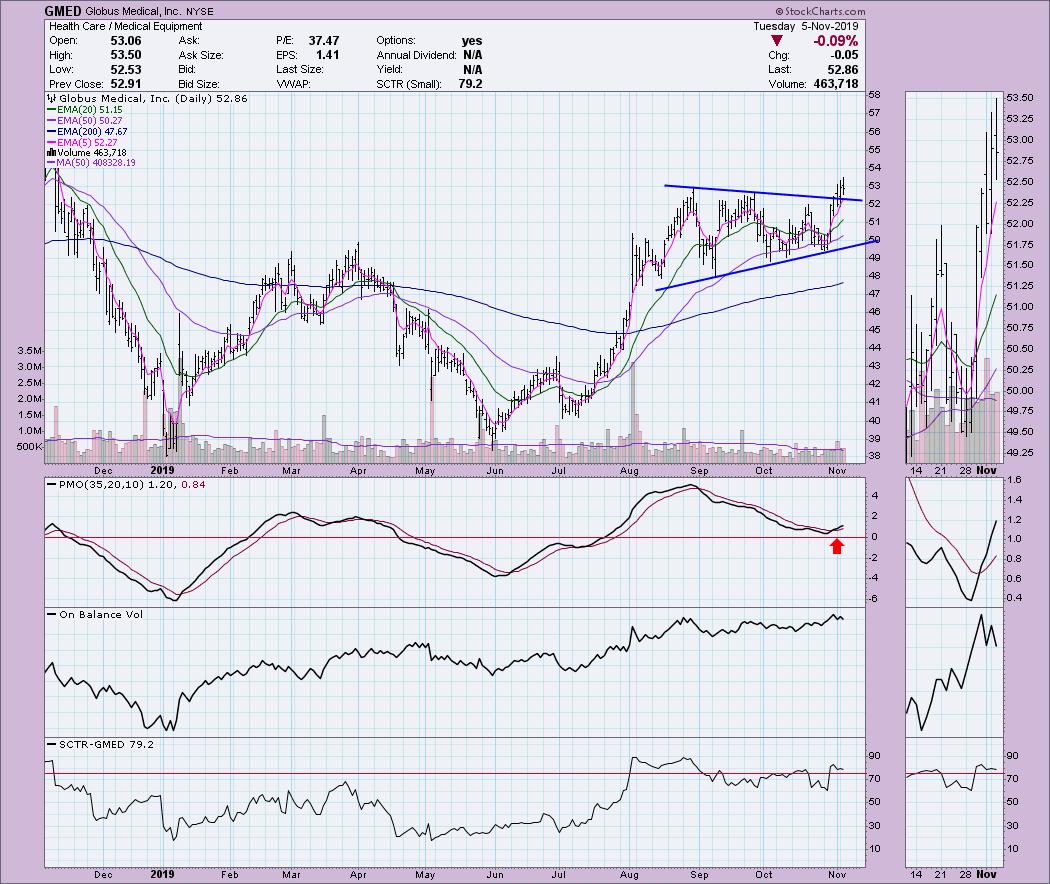
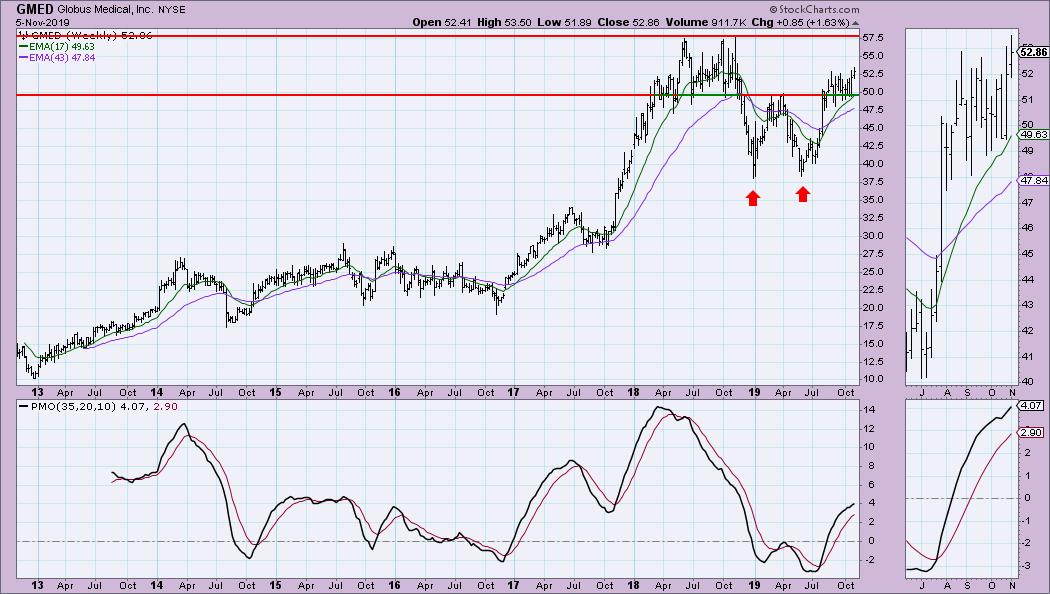
THEN: One of my very successful Diamonds was pointed out to me by a regular reader. On GMED, I was looking for a continuation of the rally as it had just broken to the upside from a symmetrical triangle. The PMO had just triggered a BUY signal. The weekly chart showed a potential upside target at overhead resistance at the all-time highs.
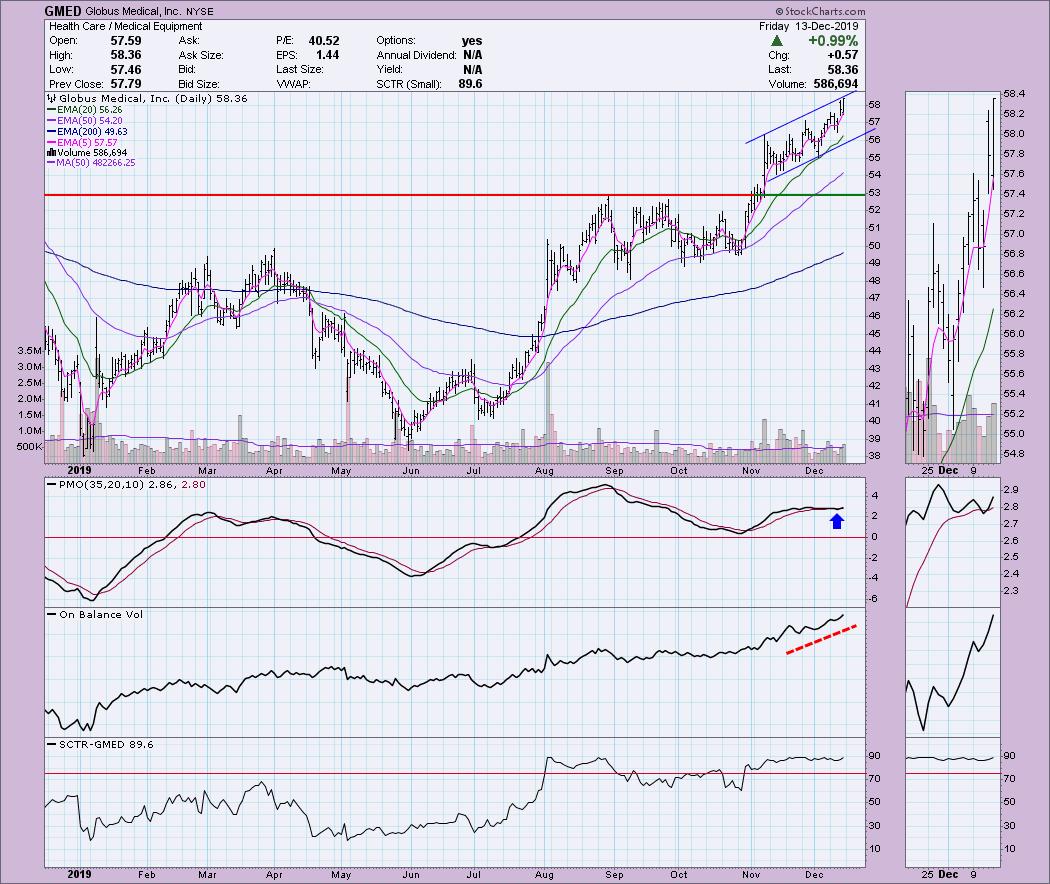
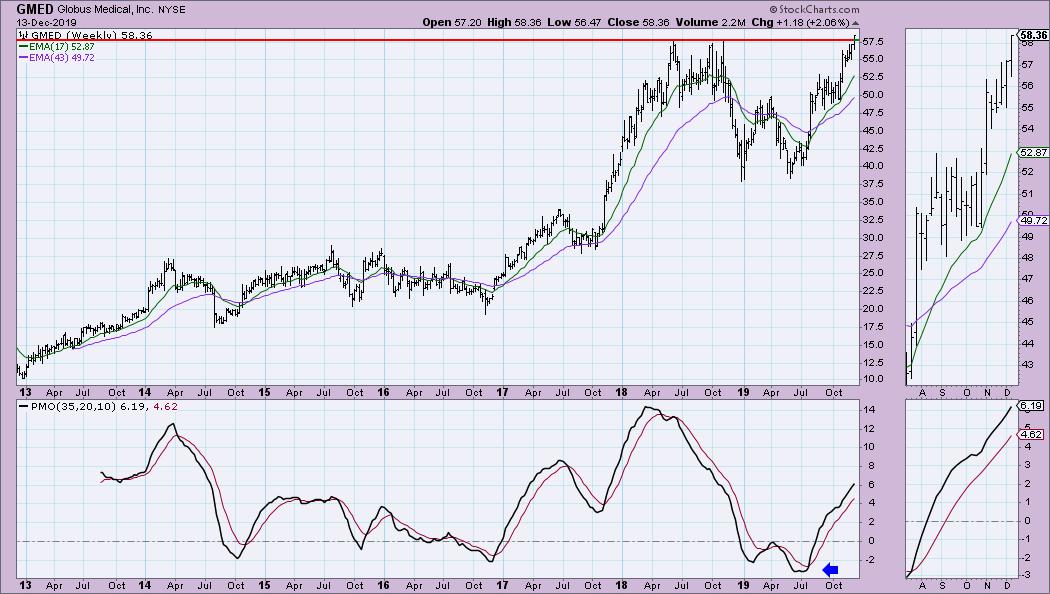
TODAY: GMED has gone from $52.85 to $58.36 since 11/9, when I originally wrote about it. It continues to look favorable as it is in a nice rising trend channel and the weekly chart looks fantastic, with today's breakout taking out all-time highs. The weekly PMO is rising sharply and is not at all overbought. In the short term, we could see a pullback toward the bottom of the rising channel, but, in the intermediate term, it looks very healthy.
Full Disclosure: I do not own any of the stocks presented.
Market Vision 2020 - Sign Up for Details
I am so excited to participate in "Market Vision 2020", an online financial conference on Saturday, January 4, 2020, to kick off the new year. Make sure you're subscribed to the Market Vision 2020 newsletter in order to receive the latest updates on the event (and save a lot of money if you decide to attend!). *Click Here* to subscribe to the free newsletter. There will be lots of giveaways and free educational events for everyone who follows along – don't be left out!

Erin Swenlin will be presenting at the The MoneyShow Las Vegas on May 11-13, 2020! You'll have an opportunity to meet Erin and discuss the latest DecisionPoint news and Diamond Scans. The conference is free to attend or view online!
Watch the latest episode of DecisionPoint with Carl & Erin Swenlin LIVE on Mondays 5:00p EST or on the StockCharts TV YouTube channel here!
Technical Analysis is a windsock, not a crystal ball.
Happy Charting!
- Erin
erinh@stockcharts.com
NOTE: The stocks reported herein are from mechanical trading model scans that are based upon moving average relationships, momentum and volume. DecisionPoint analysis is then applied to get five selections from the scans. The selections given should prompt readers to do a chart review using their own analysis process. This letter is not a call for a specific action to buy, sell or short any of the stocks provided. There are NO sure things or guaranteed returns on the daily selection of "diamonds in the rough."
Helpful DecisionPoint Links:
DecisionPoint Shared ChartList and DecisionPoint Chart Gallery
Price Momentum Oscillator (PMO)
Swenlin Trading Oscillators (STO-B and STO-V)
**Don't miss DecisionPoint Commentary! Add your email below to be notified of new updates"**


