I'll let you in on a little secret. My favorite feature on StockCharts, hands down, is ChartLists. Second only to my charts themselves, ChartLists are the thing I rely on most heavily by far.
As an active investor, I use ChartLists throughout every stage of my process. I have ChartLists that help me monitor the broader markets and their internals, all the way from the major indexes down through the sector and industry group levels. I have ChartLists for each of my portfolios, which help me monitor my open positions and keep a close eye on what I own. I have ChartLists for the stocks and funds I'm "stalking". I even have ChartLists for a wide array of market groups and types of ETFs, like the leveraged funds or specialized strategies.
I could go on and on all day here, but the point is, I use ChartLists for everything. They are not only the center of my StockCharts usage, but the center of my total investing process overall.
So this week, it brings me a great thrill to announce that your ChartLists are now even more powerful than ever.
Introducing ChartList Reports
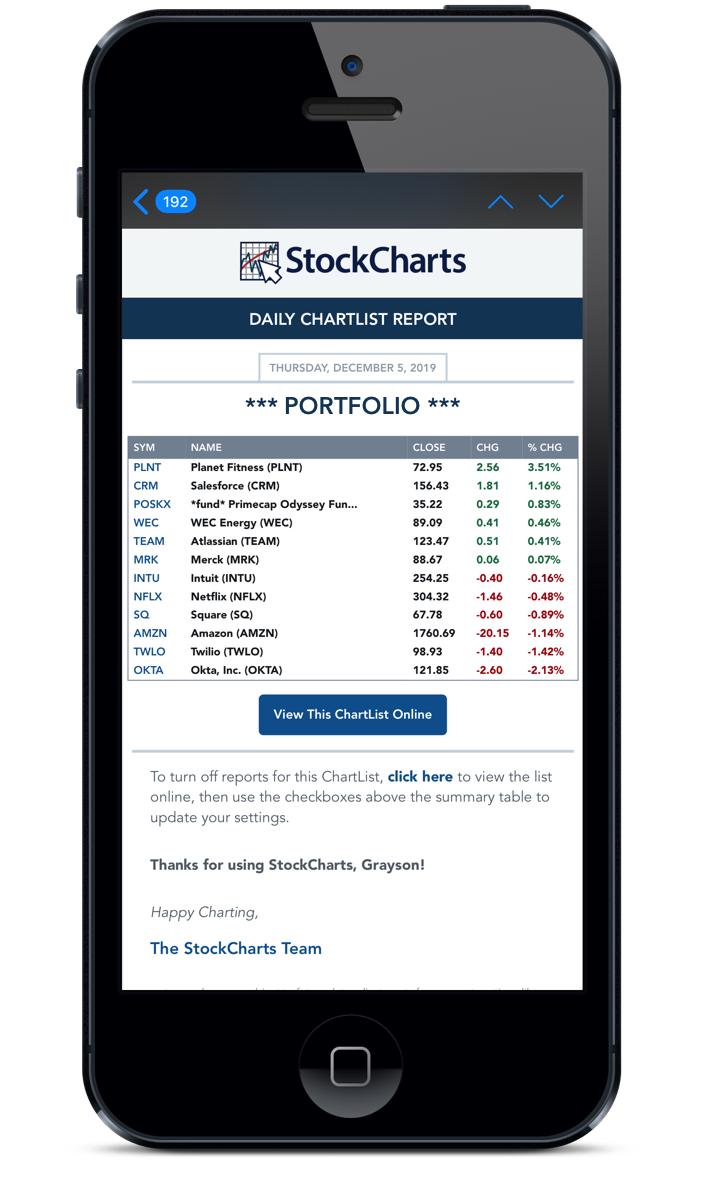
On Thursday, we rolled out a helpful new feature for StockCharts members called "ChartList Reports". With the simple click of a checkbox, you can now turn on daily or weekly ChartList Reports for any of your saved lists. After the market closes, we'll automatically email you a performance summary for all the stocks, funds, indexes or other securities saved in that ChartList.
The concept is simple, but our team has already found it to be quite powerful. For instance, you can use these ChartList Reports to monitor your portfolio(s), track your own unique set of market indexes, follow specific groups like the S&P Sector SPDRs or Dow Industries, and much more. Anything you're watching in a ChartList could be a candidate for our new reports feature.
Especially if you've got your email on your phone – as most of us do these days – I've personally found that these new ChartList Reports are wonderfully helpful and seriously convenient. They're a time saver for sure, and in our endlessly busy world, these simple reports can help you stay true to your routines and never miss a beat in the market, even while you're out on the go.
How Our New ChartList Reports Work
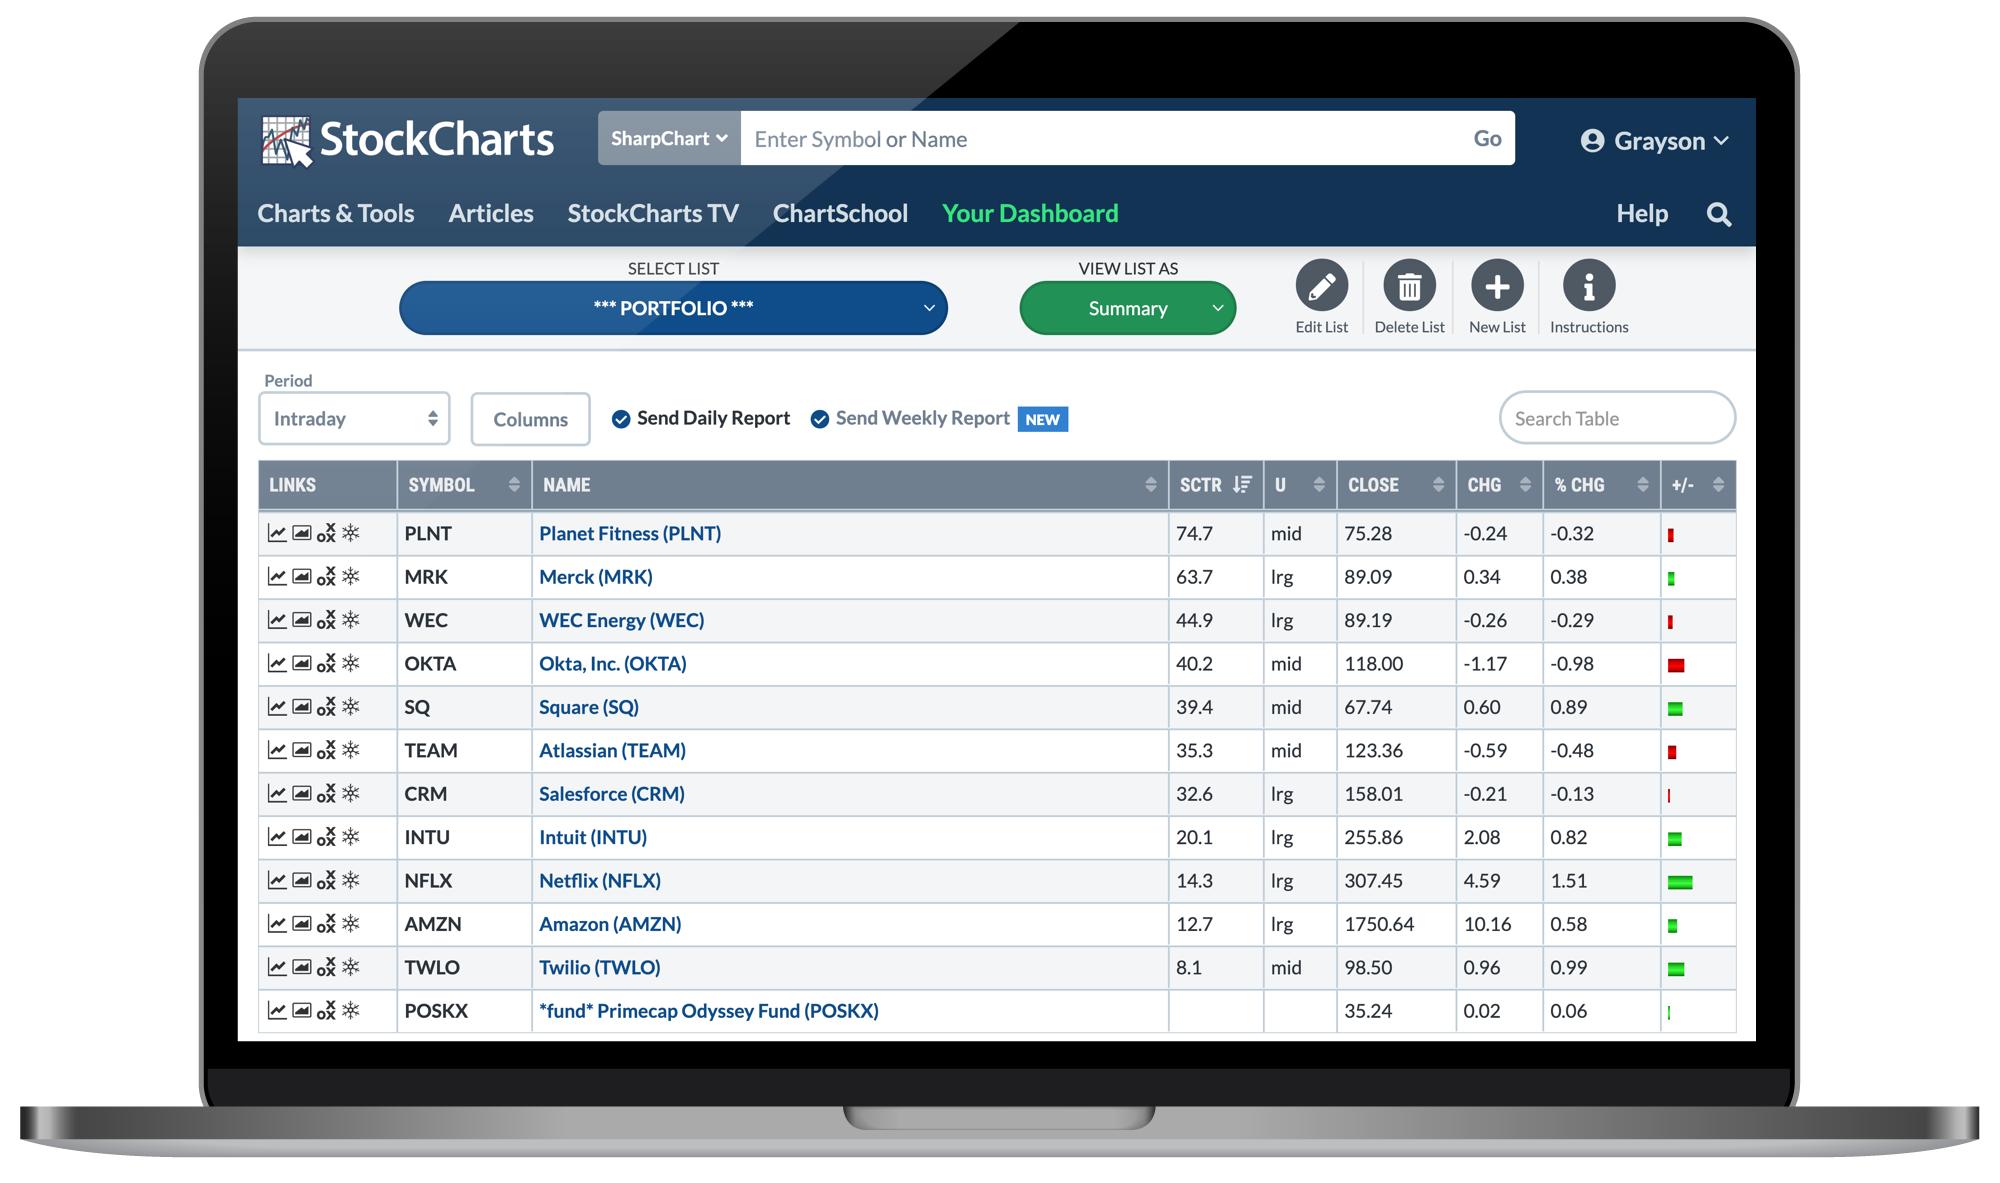
To turn on daily and/or weekly ChartList Reports for any of your lists, first pull up the Summary View for the list. Just above the summary table, you'll now see two new checkboxes that say "Send Daily Report" and "Send Weekly Report". Click to turn 'em on – simple as that! You'll start seeing report emails in your inbox the next day.
As you probably guessed, the daily report includes a performance summary for the most recent trading session, while the weekly report includes a performance summary for the most recent trading week.
Multi-Market Timing
When you first turn on a ChartList Report, you'll see a dialog box pop up that allows you to select the timing of your reports for that ChartList – i.e. US, Canada, UK, India. Reports for different ChartLists can be sent at different times, so if you have one ChartList focused on Canadian equities and another focused on the UK, the reports can be delivered at the appropriate hour. Good news there for all you global marketwatchers or international investors!
See How David Keller Is Using ChartList Reports
David Keller, Chief Market Strategist here at StockCharts, gave a full rundown of the new ChartList Reports feature on his Friday edition of The Final Bar. The quick clip below will give you a sense of how the new tool works and will provide some helpful insights into how David is using these reports for his own account.
As with any new feature, we'd love to hear your thoughts. Give these new ChartList Reports a shot and let us know what you think!
By the way, if this is sounding like it could be a helpful boost in your trading or investing but you're not yet a StockCharts Member, don't forget about our free 1-month trial! The best is always reserved for our members, so you'll instantly unlock access to bigger, better, more advanced charts, the ability to save your charts to ChartLists AND get daily and weekly reports on them, create custom scans and technical alerts and much more. Click Here to get started.
Chart On, My Friends.
Grayson Roze
VP of Operations, StockCharts.com
Chart on, my friends.
Grayson Roze
- Director of Operations, StockCharts.com
- Author, Trading For Dummies (Wiley, 2023)
- Author, Tensile Trading: The 10 Essential Stages of Stock Market Mastery (Wiley, 2016)
- Co-Founder, StockMarketMastery.com
- Twitter: @GraysonRoze