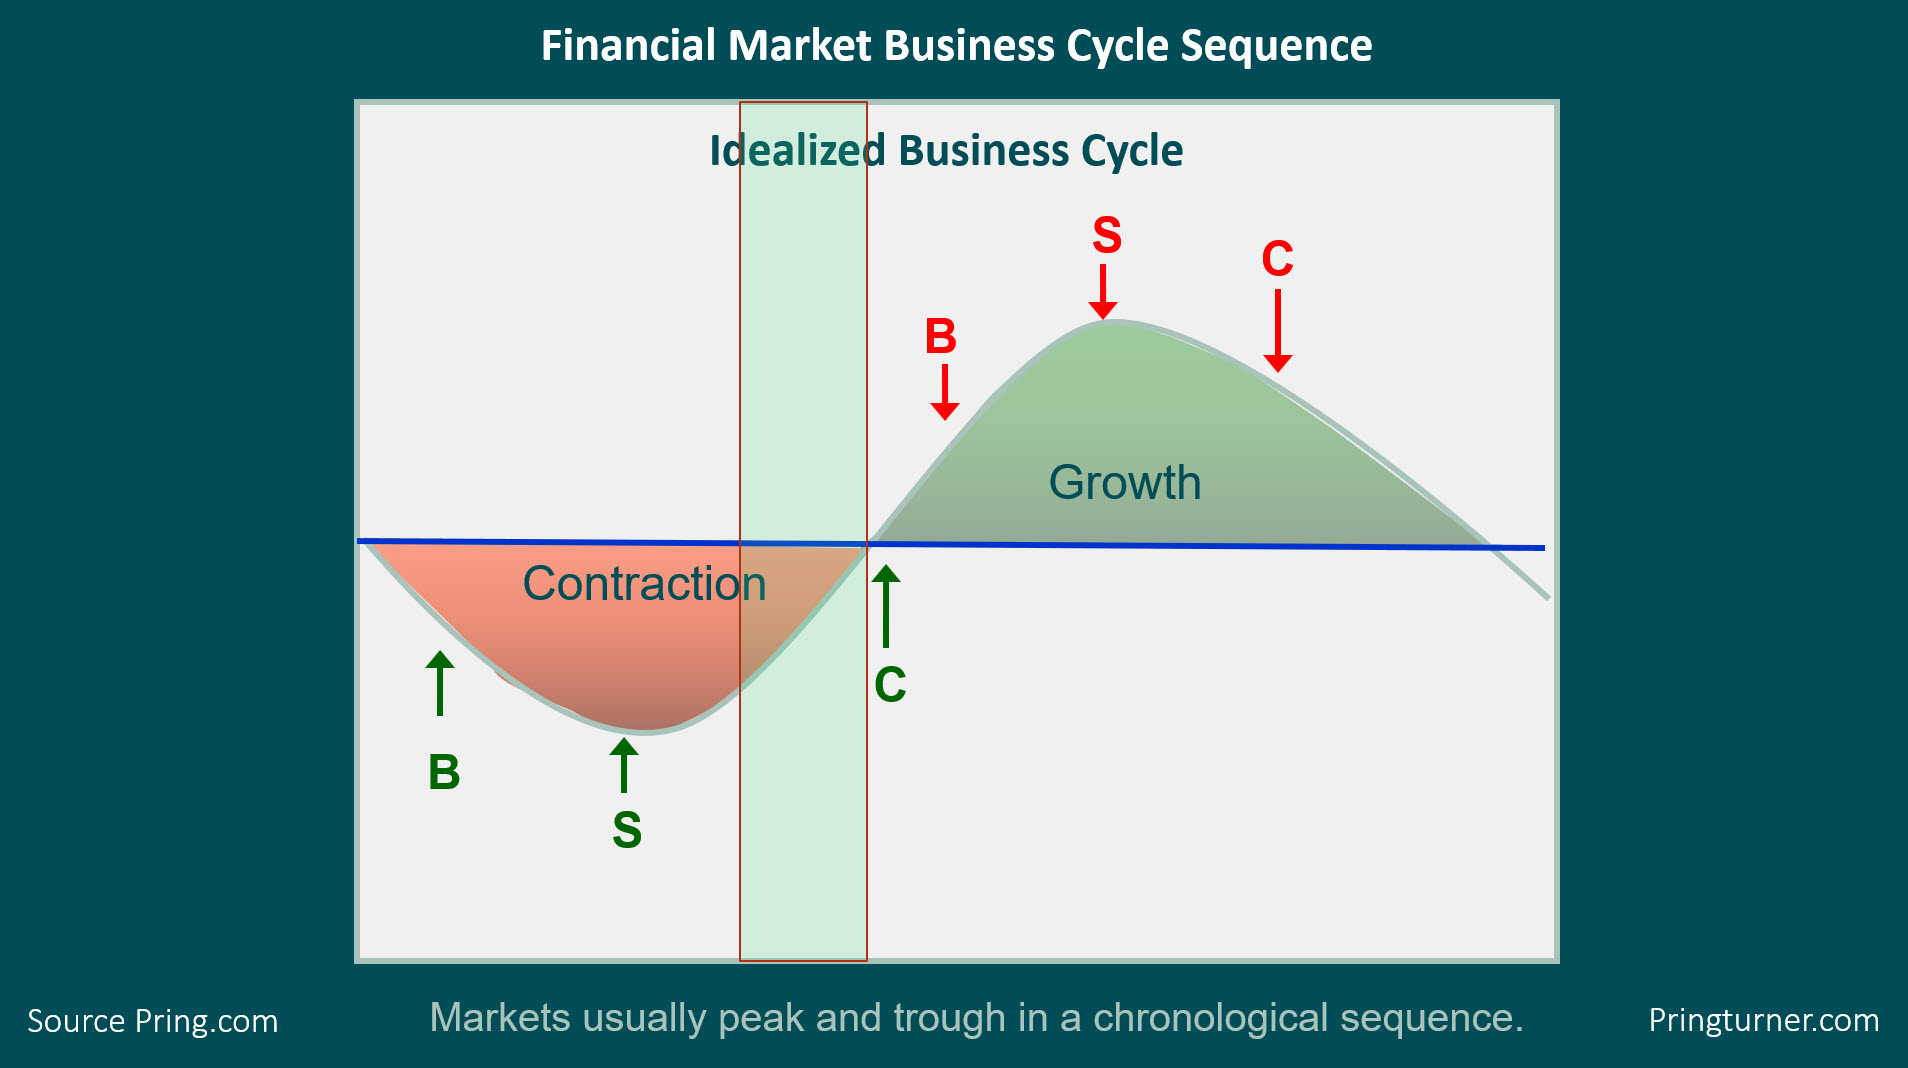
In my Monthly Market Roundup last week, I repeated a talk that I recently gave at the CMT Summit in Mumbai. The talk in question began with an outline of the approach we take at Pring Turner for our sub-advisory services and in the Intermarket Review, my monthly publication that analyses the the US and world markets from a long-term technical point of view. Figure 1, which portrays the growth path of the economy, sets the scene by pointing out that most US business cycles go through a set series of chronological events, as well as that the primary trend turning points of bonds, stocks and commodities fall into that sequential approach. We use this approach as a road map to help determine where we are in the cycle. In that way, we can optimize our asset allocations to favor bonds and interest sensitive equities at the start of the cycle and inflation-sensitive sectors as the cycle matures.
The sequence begins during a recession, when the Fed is adding liquidity to the system. This causes rates to peak and bond prices to bottom. Later, the players in the stock market begin to realize that lower rates will result in a recovery, so they start buying equities in anticipation of it. Then, when the economy does perk up, commodities bottom, so now all three markets are in a rising phase.
All good parties must come to an end, which means a peak in bond prices as credit demands pick up and the Fed is less accommodative. Rates may be rising, but profits are improving faster, so stocks continue to advance until they eventually begin to anticipate the next recession by entering a bear phase. Finally, commodities peak and the cycle begins again. Virtually all of my long-term indicators, including my consensus Bond, Stock and Commodity models are indicating that the current cycle is in the green-shaded rectangle. With bonds and stocks both in a primary bull market, the next event on the calendar to look for is a low in commodities.
"But wait," I hear you saying, "how can that be, as we are not coming out of a recession?"

Figure 1
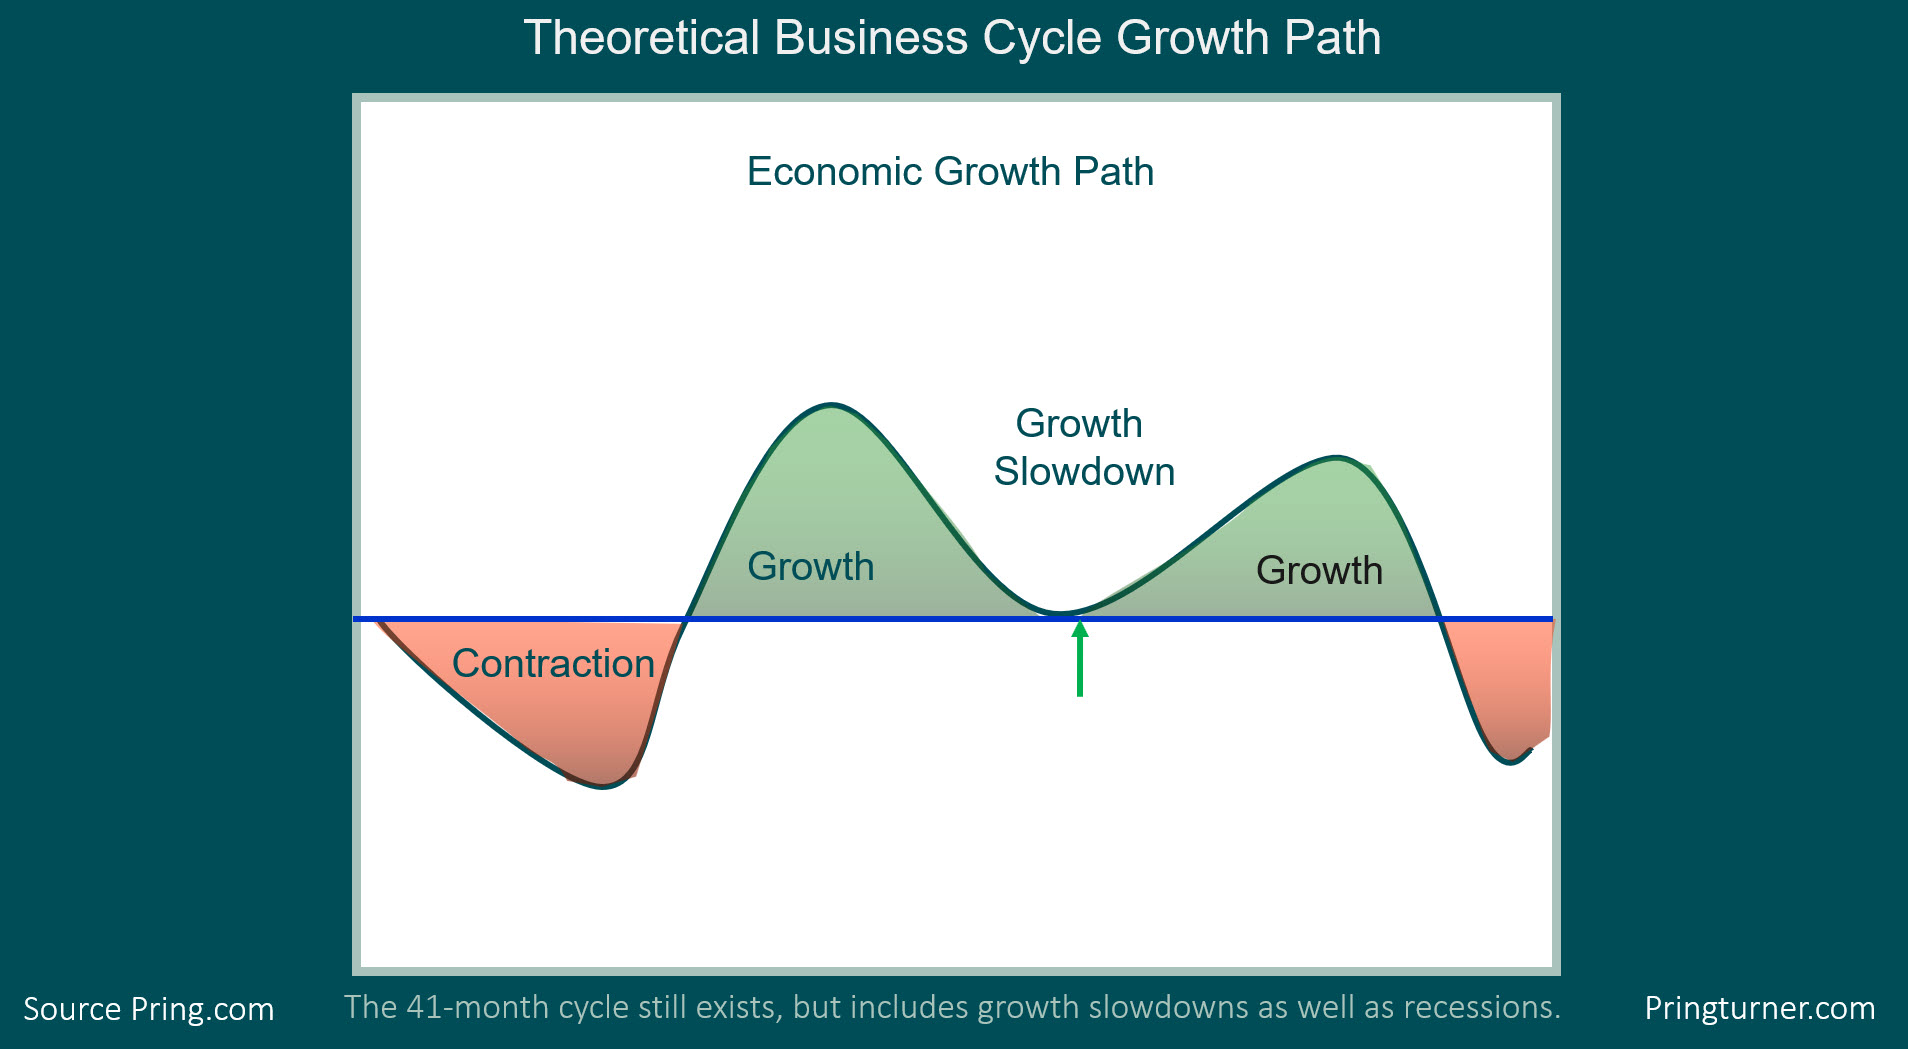
The answer is that, since 1960, there have been just as many slowdowns as recessions. Slowdowns develop when the growth rate of the economy declines (without seriously dropping below zero) but the sequential bond/stock/commodity relationship remains valid. The major difference is that the magnitude of equity and commodity bull markets is far lower. This concept is featured in Figure 2. My estimate, based on the trajectory of several long-term indicators, is that we are currently around the position of the green arrow. If that's the case, that elusive bear market bottom in commodities may not be far away.

Figure 2
Editor's Note: This is an excerpt of an article that was originally published in Martin Pring's Market Roundup on Friday, December 6th at 3:09pm ET. Click here to read the full article.
In this period of Cyber Monday and Black Friday sales, I would be remiss if I did not point out that we at Pring.com currently have a special on our already discounted Intermarket Review 3-month trial, provided you use the code "Trader1".
Good luck and good charting
Martin J. Pring
The views expressed in this article are those of the author and do not necessarily reflect the position or opinion of Pring Turner Capital Group of Walnut Creek or its affiliates.


