The Dow is one of those lists of big companies that doesn't necessarily have the most aggressive names, but they are definitely some of the world leaders. After reviewing the Dow 30 this week on Market Buzz, I can say at least five names look ready to break out and take this market higher.
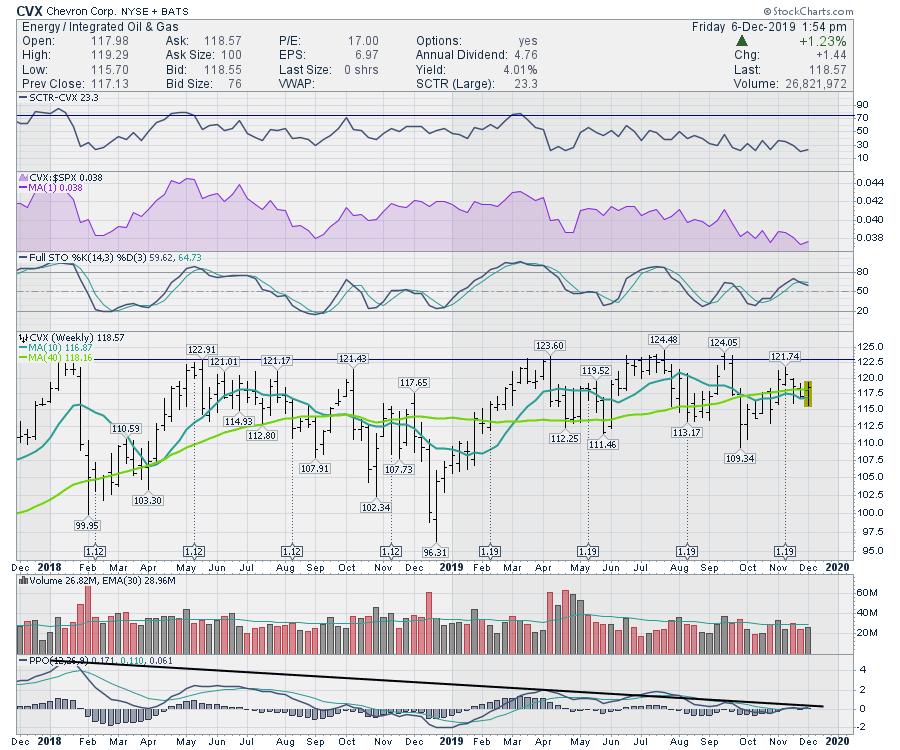
In order to get excited about Chevron (CVX), I would want to see a few things happen on the chart. First of all, a push through $123, with a weekly close up there, would mark a fresh new highs close. A break above the two-year consolidation looks wonderfully bullish. There has been a downtrend in momentum, as shown on the PPO. A break above this trend line would probably be a strong indication that the momentum was changing. A change in momentum (PPO) and the price breakout happening would also be a change in trend confirming each other. Stay tuned.
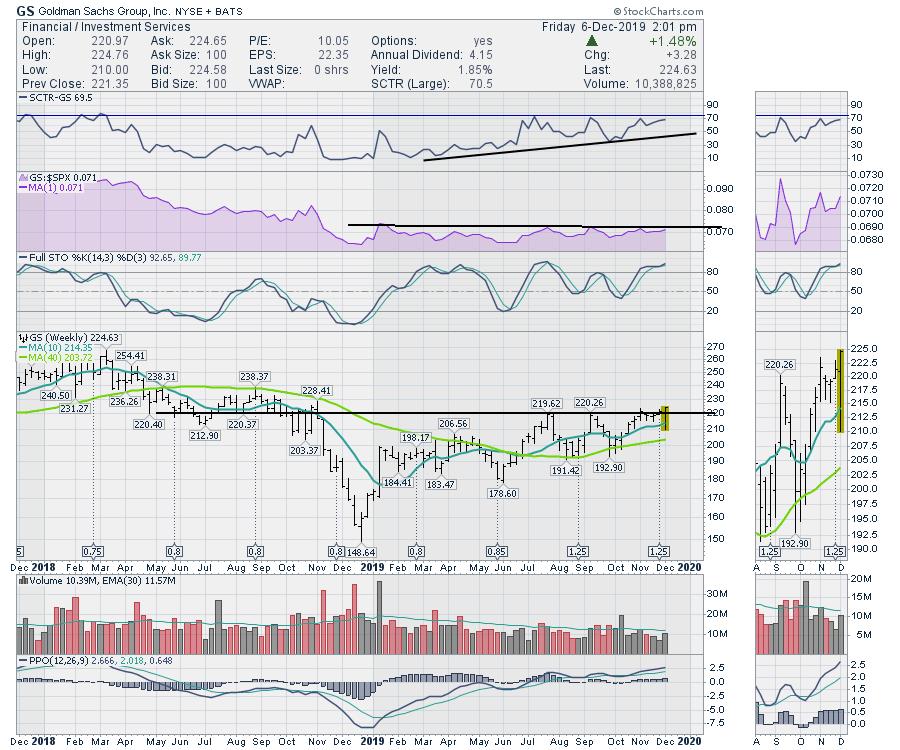
Goldman Sachs (GS) made a new 52-week high this week as well. A few weeks ago, Goldman managed to make a new 52-week high intra-week, but closed below the breakout level for the week. At the time of writing on Friday afternoon, it looks like GS is going to mark a new 52-week high!
I'd like the stock to get the SCTR up in the top 25% to help it attract more investors. Goldman hasn't been a top-performing stock for the two years on the chart. Ouch! It should also start to outperform in relative strength.
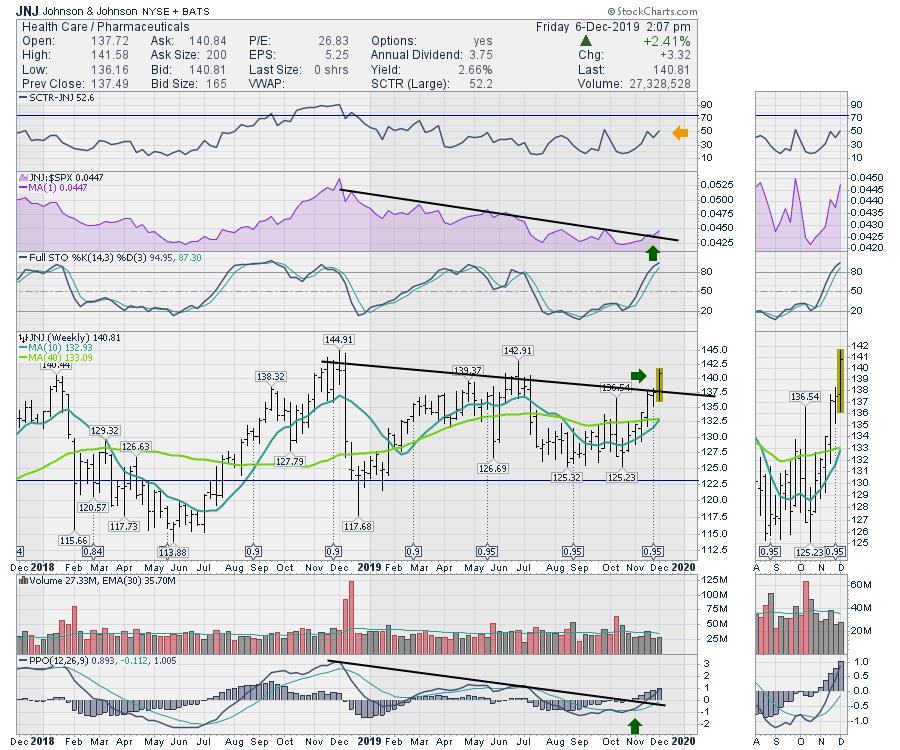
Johnson and Johnson (JNJ) has spent more time publicly in the courtrooms than in the lab this year, but the chart is showing a push above the downtrend, with the line placed where the weekly closes were. This change in trend looks good. Another weekly candle this big would push JNJ to new highs. The SCTR is at the top of the range it has been at, so a push here would suggest a change for the company as well. The relative strength downtrend is also breaking, which is good news. I also like that the downtrend in momentum has also been broken.
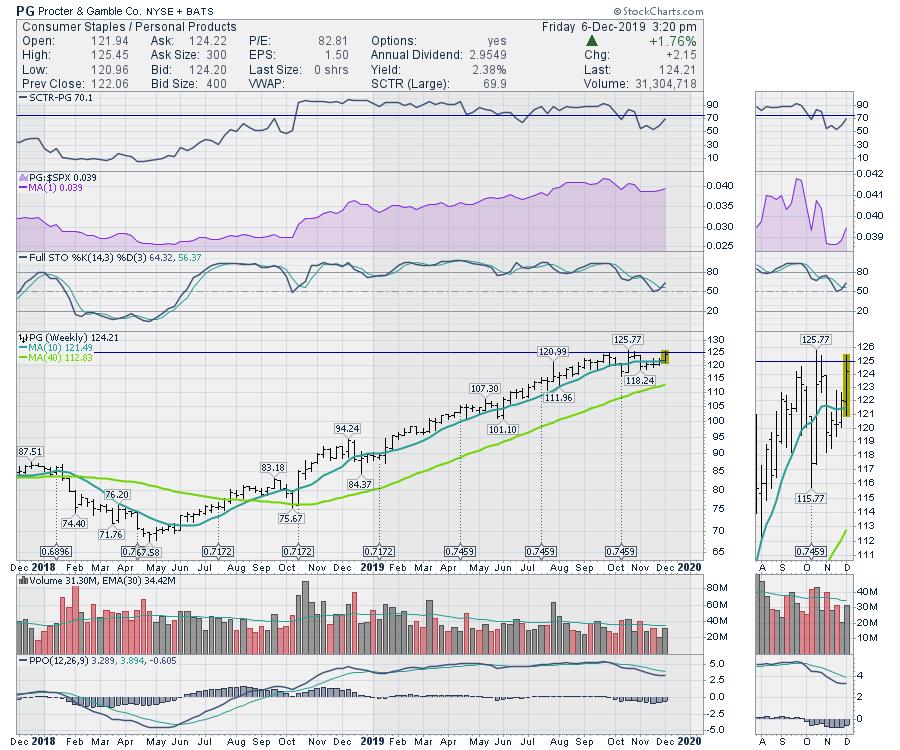
Proctor and Gamble (PG) is also trying to break out. The chart setup is nice. The full stochastic is bouncing where it should (50) to stay in bull market mode. The SCTR ranking has been positive for a whole year and has now started to pull back a bit. I would like to see the SCTR get back up into the leadership quadrant above 75. Momentum on the PPO is at a nice high level of 2.5% which can stay up here for a while. When it starts to make lower lows below 1%, I would be more sensitive to a drifting PPO.
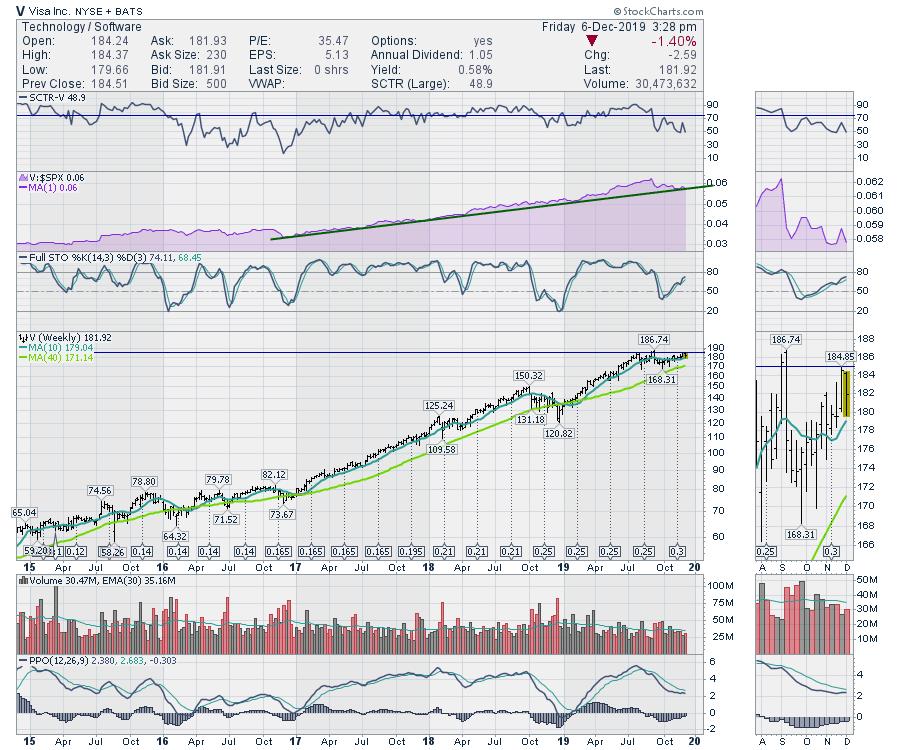
Lastly, there's Visa (V). This chart is a five-year chart, unlike the charts above, which were 2-year charts. I like the stock here. I have one reservation that is good to note, but the stock is still a buy right here. I do not want to see the relative strength line in purple start to break. When a strong stock that has outperformed for years starts to underperform, that will create selling by institutions. I would rather exit the stock, or at least protect my gains with options. If Visa started to turn down here, be sure to notice the divergence of a much lower PPO while price is at the same high.
This is a typical place to expect Visa to bounce and continue its uptrend, so you can have your exit signal nice and close. A break of that green trend line for two weeks would be a profit-taking signal for me if I already own the stock.
Verizon (VZ), Coca-Cola (KO) and Walmart (WMT) also look great here. Should these charts fail to keep going, that would make me more cautious. My research data suggests we are going to run higher. Last year, October, November and December all had run-ups into the start of the month and then fell away. In March, May and August of 2019, we had similar pullbacks at the start of the month. So I am not expecting a larger pullback just yet, but a 50% average in the recent history says be careful on early-month optimism.
Members of GregSchnell.com received my newsletter over the weekend suggesting the market could be starting to pull back, with one of my short-term indicators only 39% bullish. Well, that pullback happened and I suggested it was a dip to be bought. If you would like help spotting these timely setups in the market and are interested in becoming a member at GregSchnell.com, visit the private investors tab.
I'll be speaking at the Market Vision 20/20 conference on January 4th, 2020 with a host of other StockCharts analysts. For more information on the early bird special, follow this link: Market Vision 2020.
Good trading,
Greg Schnell, CMT, MFTA
Senior Technical Analyst, StockCharts.com
Author, Stock Charts For Dummies
Want to stay on top of the market's latest intermarket signals?
– Follow @SchnellInvestor on Twitter
– Connect with Greg on LinkedIn
– Subscribe to The Canadian Technician
– Email at info@gregschnell.com


