"How come small-caps aren't doing better when the market's making new highs?"
I've heard some version of this question many times over the last couple years, starting with the emergence of the FAANG trade. Once that subsided and the market resumed its uptrend, the resilience of the Technology sector became the story.
A number of my fellow StockCharts contributors have been highlighting this trend, most recently Greg Schnell, who remarked "What we're seeing is the market bifurcating into large-cap huddles and small-cap dispersion."
So, to answer the question "How come the market is going higher but small-caps really are not?", I would simply answer, "Because mega-cap tech names can push the S&P 500 way higher all on their own!"
But the real question is this: is the lack of participation a warning sign of sorts, or just an illustration of the dominance of mega cap stocks in this market regime? The answer, of course, is mixed.
There is a precedent for small-cap underperformance at market tops. Take 2007, for example.
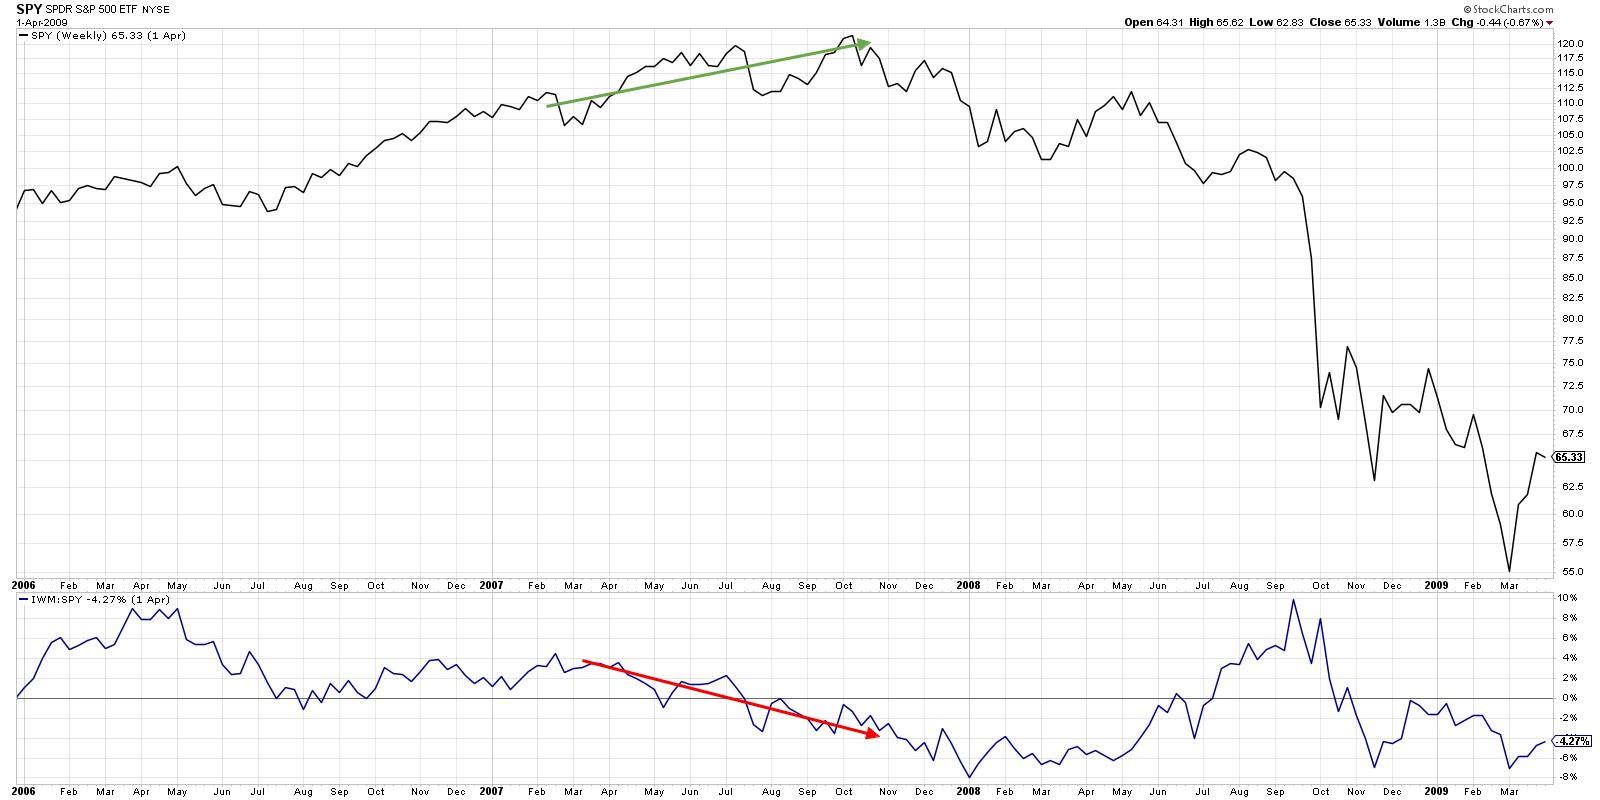
After a strong rally in the second half of 2006, the S&P 500 rallied strong through mid-2007. Starting in April, however, small cap stocks started to show signs of distribution. As the smaller, more speculative stocks sold off, blue chip mega-caps like PepsiCo (PEP) accelerated to the upside.
This divergence between small and large spoke to a flight to more conservative stocks as the higher beta small caps rotated lower. By the time the market finally topped out in October, small caps were testing support levels and the relative strength was quite negative.
So the market's probably ending the bullish phase because small caps are struggling, right?
Not necessarily.
If you look at a longer-term view of the relative performance of small-cap vs. large-cap stocks, you can see that small-caps have been struggling on a relative basis for a number of years.
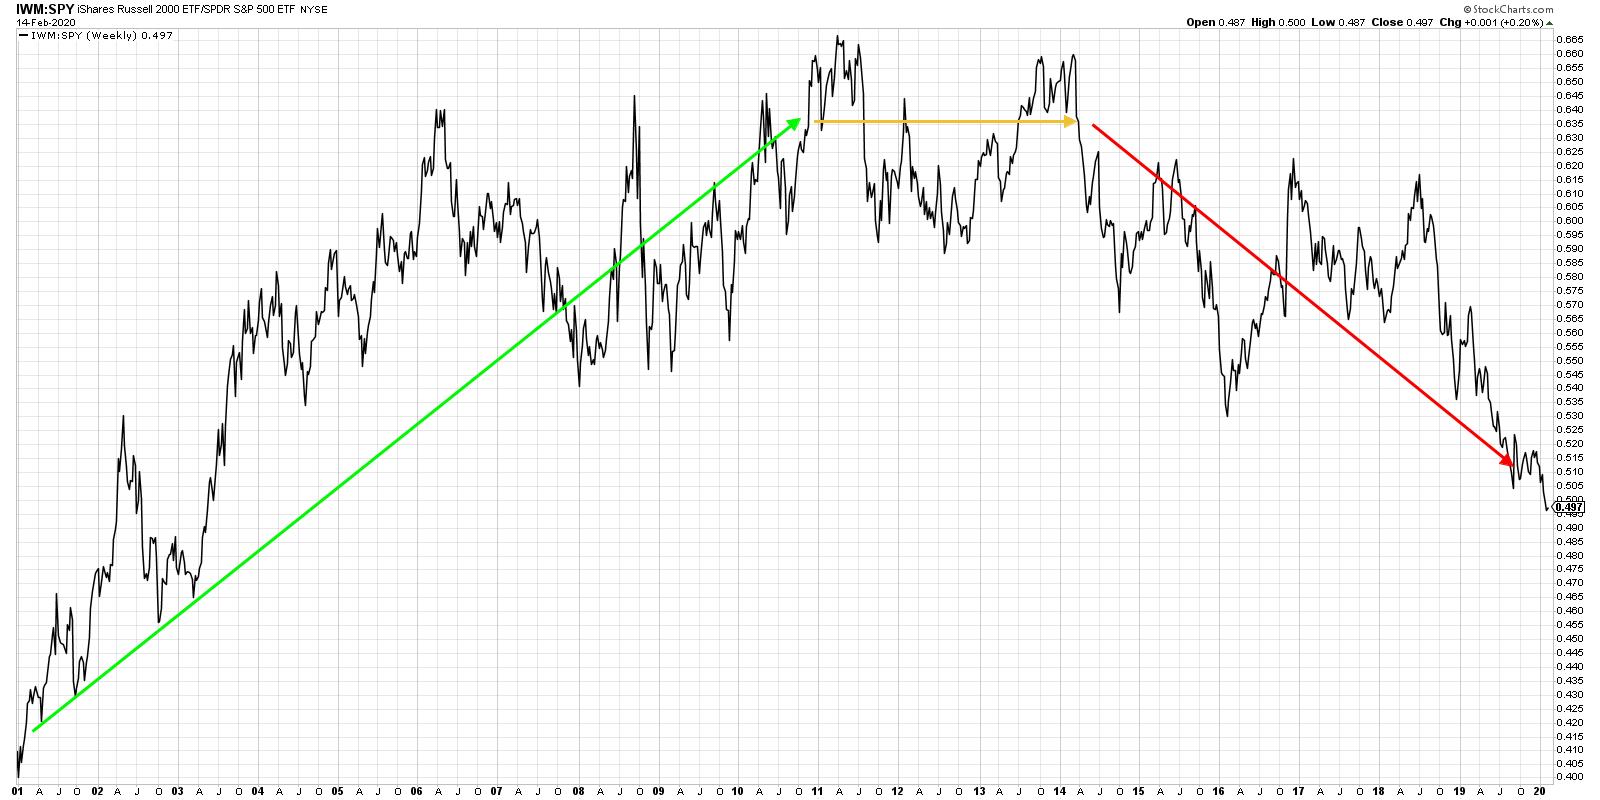
From 2001 to 2011, the small-cap ETF consistently outperformed the S&P 500 ETF, even with stretches of underperformance in 2007 and 2008. 2011 to 2014 essentially saw consistent performance between these two cap tiers, with large and small stocks moving relative in line with each other.
Since 2014, this ratio has been in a consistent downtrend. While there are many potential reasons for this performance phenomenon, I would speculate that the outperformance of mega-cap technology and consumer stocks put pressure on institutions to own those names. The more buying pressure that builds, the more demand for these stocks, and the higher the prices go.
What does all of this mean for the current market environment?
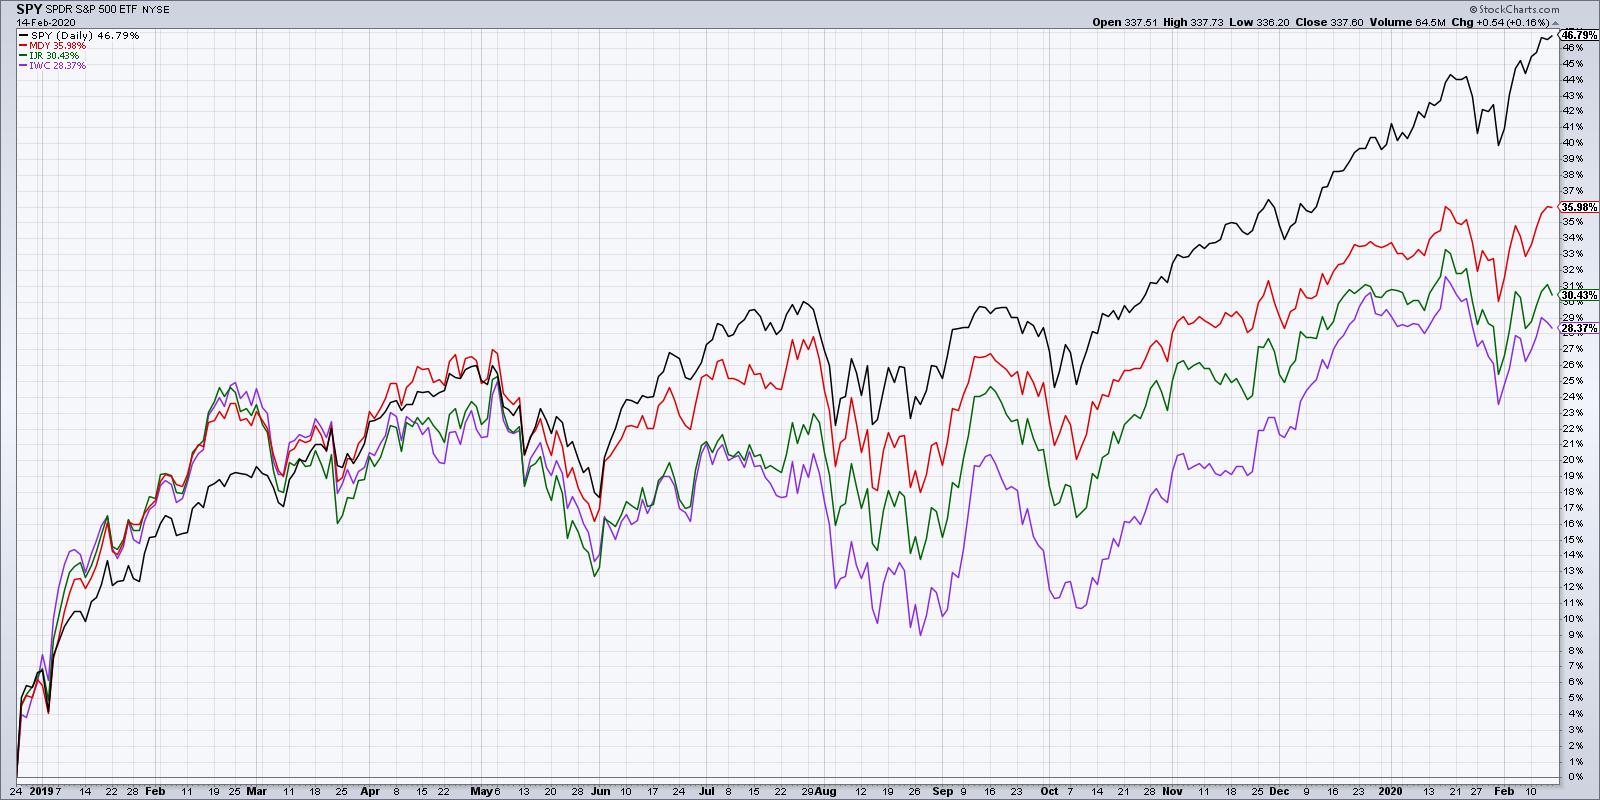
Since the December 2018 market bottom, large caps have dominated, with the S&P 500 returning almost 47%. Mid-caps were up 36% over that same time period, followed by small-caps (+31%) and micro-caps (+28%).
I'm seeing the S&P 500 breaking to all-time highs, mid-caps testing resistance, and small- and micro-caps potentially establishing lower highs. While this bearish divergence would usually suggest a negative bias due to the underperformance of the higher beta names, I would argue that it may just be a characteristic of the new market regime of mega-cap dominance.
Most importantly, until the S&P breaks down through some sort of support level, confirming a lower low, the path of least resistance is up.
RR#6,
Dave
David Keller, CMT
Chief Market Strategist
StockCharts.com
Disclaimer: This blog is for educational purposes only and should not be construed as financial advice. The ideas and strategies should never be used without first assessing your own personal and financial situation or without consulting a financial professional.
The author does not have a position in mentioned securities at the time of publication. Any opinions expressed herein are solely those of the author and do not in any way represent the views or opinions of any other person or entity.


