Two weeks ago, I wrote a ChartWatchers article titled "RRG Suggests Aggressive Trade Setup for XLY vs. XLV." In this article, I want to show you how you can take that idea one step further and, at the same time, answer a question on how you can easily zoom in on Industries instead of staying at the sector level.
From Sector to Industry
To start with the latter: "How do we zoom in to Industries from Sectors?". Obviously, you could set up the RRG holding all Industries that belong to a sector, saving that RRG to a bookmark using the permalink button available under each RRG. Once you do that eleven times, you will have easy access to all industries per sector.
But... there is an easier way to achieve that goal.
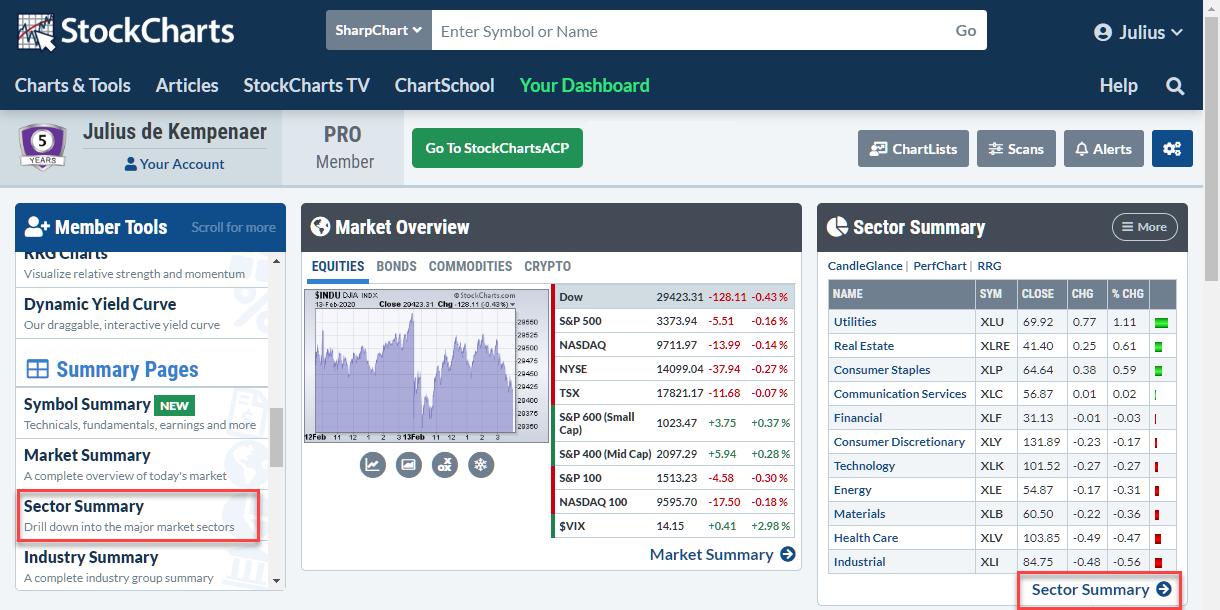
Here's what you see when you open up the Sector Summary page, which you can easily do from your dashboard.
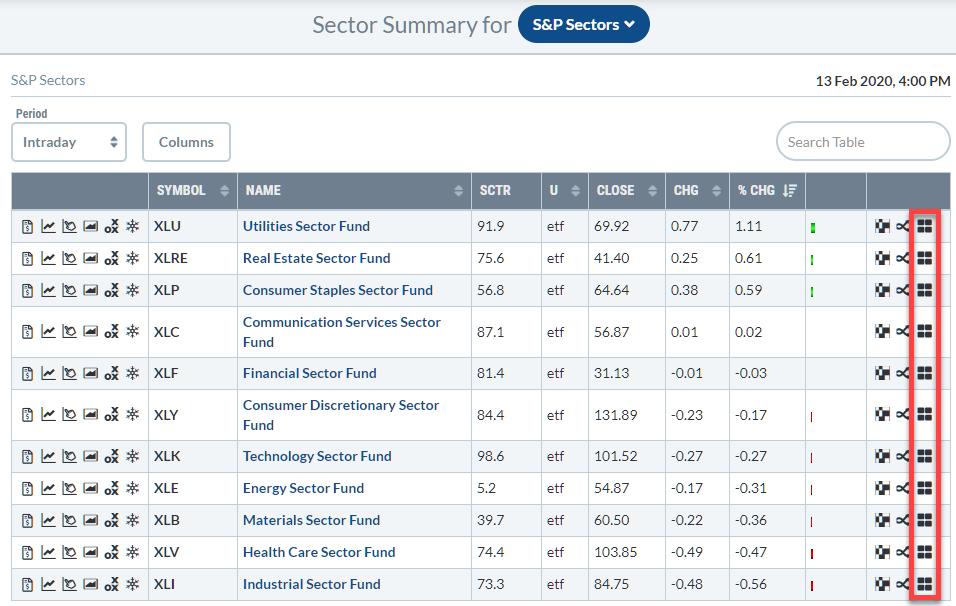
What you get is a table with eleven rows, one for each sector. Each line holds a ton of information for that sector, as well as some icons for easy access to charting tools on StockCharts.
In front of the ticker symbol, you will find icons that will take you to single-security tools, like a SharpChart, but also the brand new Symbol Summary page or to ACP. At the end of the line, you will find the icons that lead to multi-security tools, e.g. Market Carpet and PerfCharts. The last icon on the line will take you to a Relative Rotation Graph.
Clicking on that RRG icon will open up an RRG that shows the Industry groups within the sector against SPY. Once the RRG is open, you can change the benchmark to the sector; this presents the rotation of the industries against the sector instead of the general market, which we usually use when looking at sector rotation.
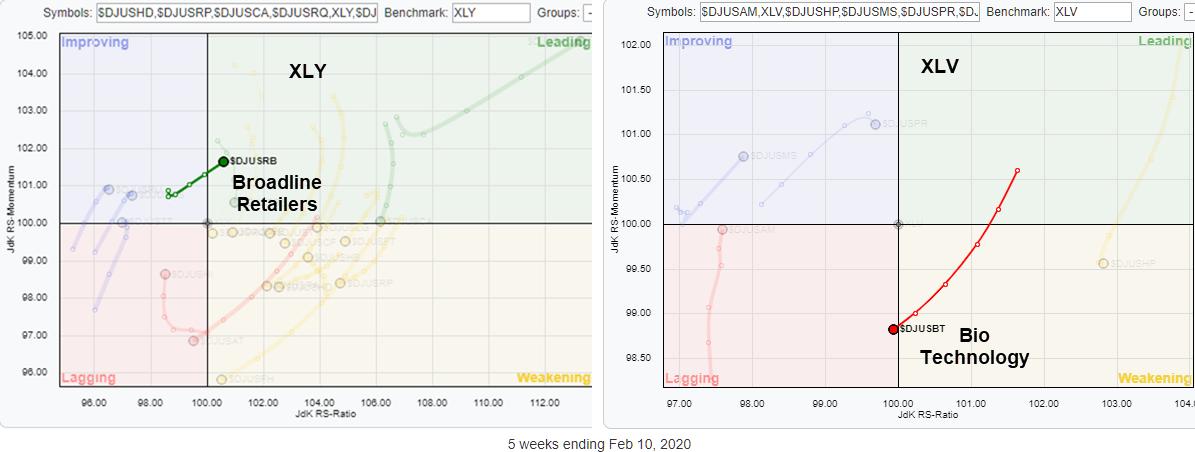
Back to the markets. A few weeks ago, RRG picked up the opposite rotations for Consumer Discretionary and Healthcare, suggesting an outperformance for XLY over XLV in the weeks to follow. That move is underway now.
When you spot such a rotational pattern on an RRG for sectors, you could take your analysis one step further instead of stopping at the sector level. In order to do that, we need to bring up the RRGs for the industries that make up both sectors. These are shown side by side at the top of the article, but here are the full-size charts for both sectors.
Consumer Discretionary - XLY
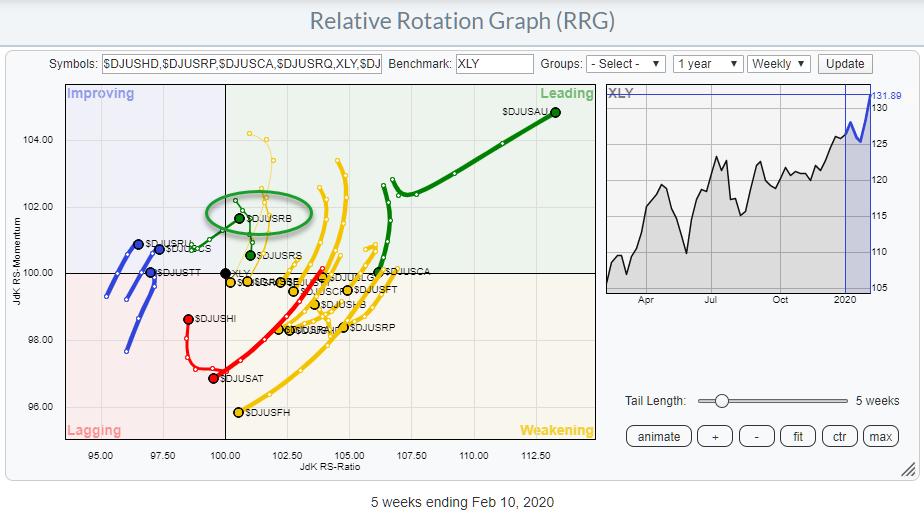
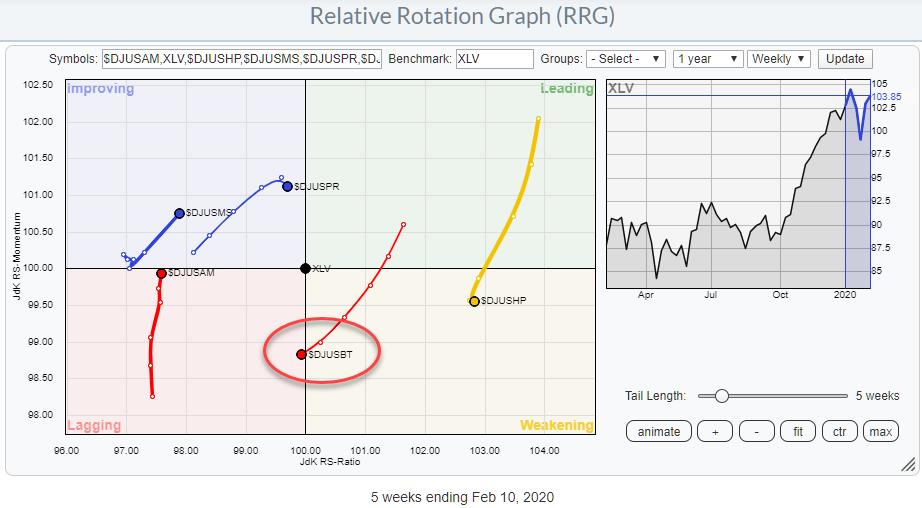
This RRG shows the rotation for 20 Industries (btw, that's a lot compared to other sectors) that make up the Consumer Discretionary sector.
The industry shooting for the stars inside the leading quadrant is the DJ US Automobiles index... I wonder why that would be? ;)
Because it has already moved far away from the benchmark, the risk to join that move is shifting the odds against us, IMHO. I look for groups that are at a positive RRG-Heading and are only just inside (or close to entering) the leading quadrant.
The one that I found here is $DJUSRB, the Broadline retailers index.
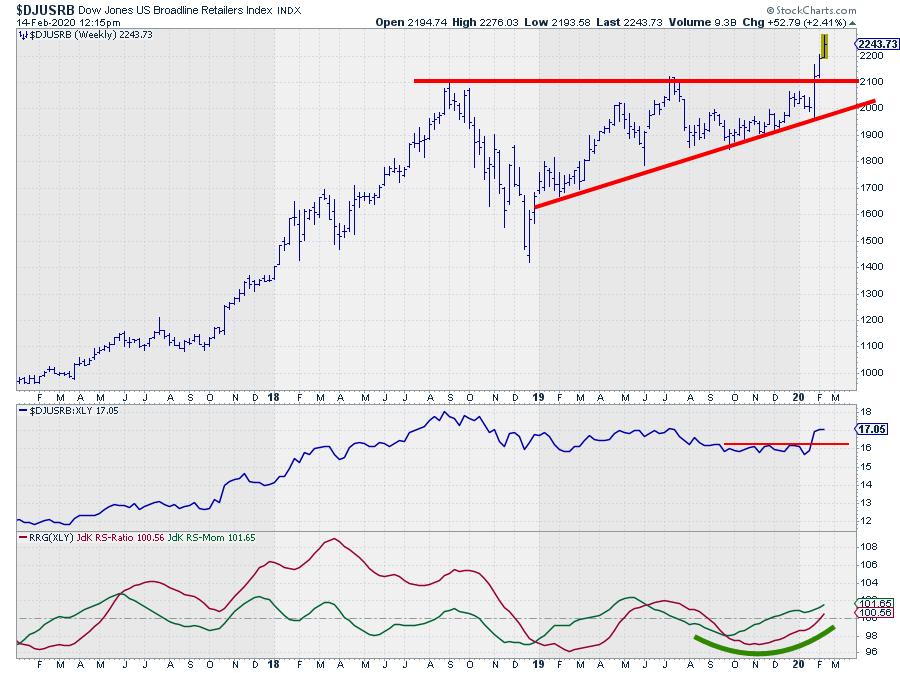
The break above that horizontal barrier looks very promising, and this move helped the raw RS-Line to take out a small overhead resistance level, which is sending upward impulses to the RRG-Lines. This makes US Broadline Retailers a strong industry within the Consumer Discretionary sector, which is already improving against SPY.
Healthcare - XLV
The RRG above shows the Industry groups that make up the Healthcare sector, using XLV as the benchmark.
The group that shows the clearest "signal," if you wish, is $DJUSBT, the Biotechnology index. The tail over the last five weeks moved from leading through weakening and has just now entered the lagging quadrant at a negative RRG-Heading. This makes it the only group inside the lagging quadrant that is traveling at a negative RRG-Heading.
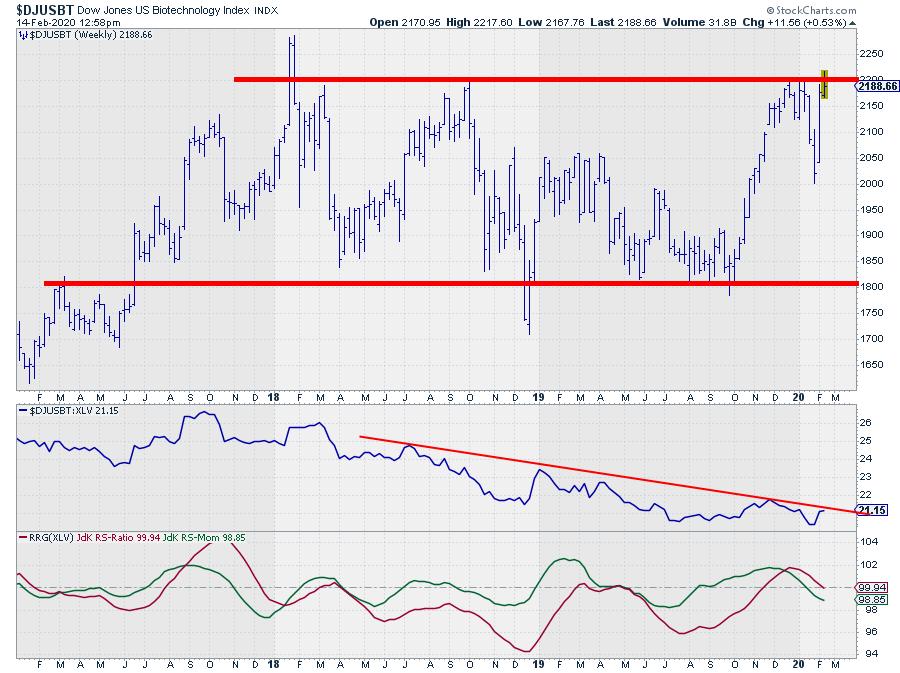
The price chart, in combination with relative strength and the RRG-Lines that drives this tail, shows a broad trading range for $DJUSBT that has been in play for more than two years already. The recent rally brought this index back to the upper boundary at the end of 2019 and the beginning of 2020. At the moment, there is another attempt to break that barrier underway.
Clearly, when that level breaks, that would be a good sign, but the weak relative strength against the sector index (which in itself is already weak against the market) makes such a break unlikely, IMHO. Beware, as this is a completely subjective judgment, but the weight of the evidence of the puzzle pieces in front of us today brings me to this interpretation.
Wrapping up
Taking the analysis from a sector level one step further down the pyramid, trying to find good (or bad) industry groups within the sector means a more aggressive approach. This inhibits extra risk, but also extra potential rewards. RRG can help you to find these opportunities in a structured manner.
From a trading perspective, the sector level is very convenient, as tradable instruments are readily available and usually pretty liquid from both the long and the short side. Trading at industry group level may throw up some challenges, as not all groups are covered by ETFs or other tradable instruments, but you may find good alternatives by looking at the big(gest) stocks in that group and using them as a proxy.
--Julius
My regular blog is the RRG Charts blog. If you would like to receive a notification when a new article is published there, simply "Subscribe" with your email address.
Julius de Kempenaer
Senior Technical Analyst, StockCharts.com
Creator, Relative Rotation Graphs
Founder, RRG Research
Want to stay up to date with the latest market insights from Julius?
– Follow @RRGResearch on Twitter
– Like RRG Research on Facebook
– Follow RRG Research on LinkedIn
– Subscribe to the RRG Charts blog on StockCharts
Feedback, comments or questions are welcome at Juliusdk@stockcharts.com. I cannot promise to respond to each and every message, but I will certainly read them and, where reasonably possible, use the feedback and comments or answer questions.
To discuss RRG with me on S.C.A.N., tag me using the handle Julius_RRG.
RRG, Relative Rotation Graphs, JdK RS-Ratio, and JdK RS-Momentum are registered trademarks of RRG Research.
Julius de Kempenaer
Senior Technical Analyst, StockCharts.com
Creator, Relative Rotation Graphs
Founder, RRG Research
Host of: Sector Spotlight
Please find my handles for social media channels under the Bio below.
Feedback, comments or questions are welcome at Juliusdk@stockcharts.com. I cannot promise to respond to each and every message, but I will certainly read them and, where reasonably possible, use the feedback and comments or answer questions.
To discuss RRG with me on S.C.A.N., tag me using the handle Julius_RRG.
RRG, Relative Rotation Graphs, JdK RS-Ratio, and JdK RS-Momentum are registered trademarks of RRG Research.


