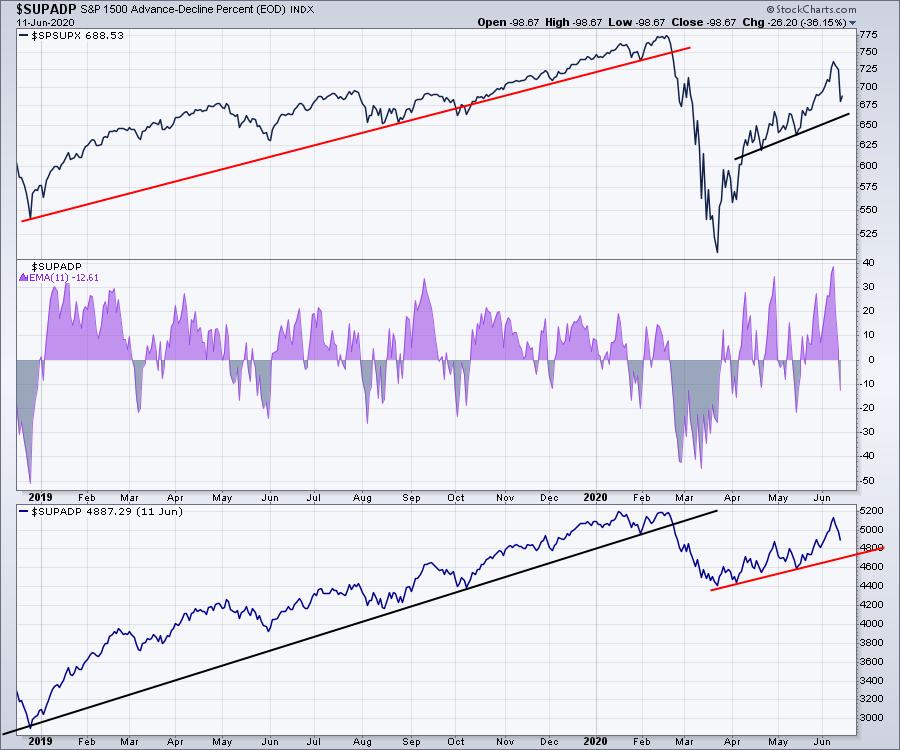
Thursday was a real portfolio rattler as most stocks went for a wild dip. Once again, the Fed meeting was one of the primary reasons for the renewed cautiousness. While the market was seemingly on a new uptrend, this was a pretty big gap for a market supported by wide breadth across sectors and industries. The chart below shows the price chart for the S&P 1500 (not the S&P 500). Below are two different looks at the advance/decline percentages for breadth. In the purple area, we have a two-week moving average of the A/D percentage. The lowest panel is a cumulative look at the indicator. The uptrend is still intact, but this was a very hard rollback. The purple area shows a major surge, but also a hard drop. With the volatility levels picking up (not shown), the trend gets rockier. The information I glean from the chart below is that this was a wild swing so far, but the uptrend is still intact.
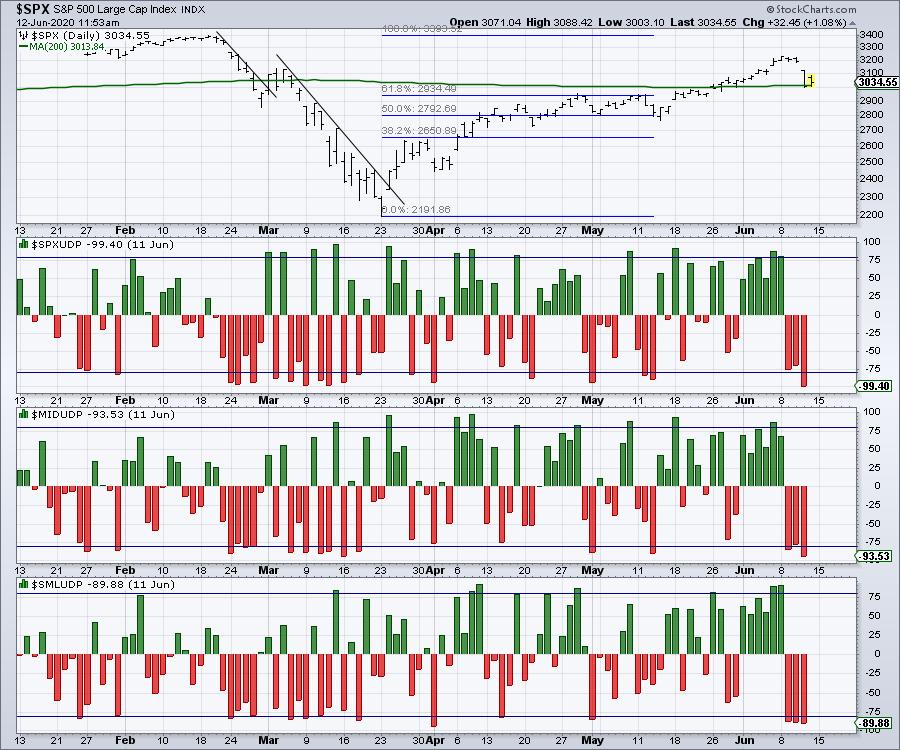
The second piece of data comes from the up/down volume percentage data. In this case, the data looks more dismal. This presentation style is from Arthur Hill, but it clearly shows this is how the market top in February started. That definitely adds more caution.
Lastly, next Friday is quadruple witching day for options expiration. The quadruple witching dates are shown in blue and they usually have extreme volumes. It is very difficult to know if the market will correct further based on the two charts above, which show contrasting information. It is reasonable to expect some volatility coming out of the options expiration, so the next two weeks look like more fireworks. All of the last four options expiration days had some swings following them.
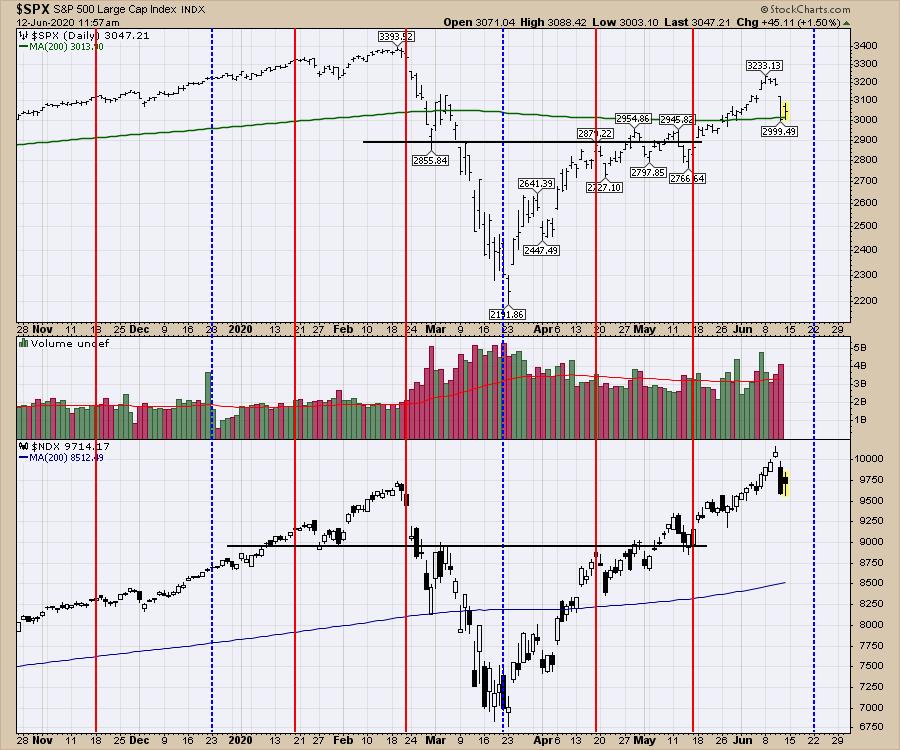
Not a bad time to trim some of the profits off here and be watchful of further downside. The Nasdaq 100 (on the lower panel) could end up being a failed breakout, whereas the $SPX (on the top panel) would be a retest and fail of the highs. I would like to think the big breadth we have would help a lot. But 5% down days are not usually showing up in the course of a regular uptrend.
Is this the end of the trend? It has some of the typical signals for it, with hard down days, failed breakouts and tests of prior highs. So far, the advance/decline data has not confirmed. Caution is advised from my perspective. That doesn't mean sell, but its a good place to be aware of the downside risk.
Good trading,
Greg Schnell, CMT, MFTA
Senior Technical Analyst, StockCharts.com
Author, Stock Charts For Dummies
Want to stay on top of the market's latest intermarket signals?
– Follow @SchnellInvestor on Twitter
– Connect with Greg on LinkedIn
– Subscribe to The Canadian Technician
– Email at info@gregschnell.com


