It has been a ride off the lows. The juggernauts continue to rise into the valuation stratosphere. Because of the large balance sheets in Tech, they have become the defense and the offense for this market. Today, I have 5 charts to think about that denote a change as we come through Options Expiration Friday. One macro thing I like to look for at meaningful inflection points in the market is cross-asset trend changes. An example would be a currency trend change, a bond market change, or a change in commodities and in equities. Sometimes you get just one or two, but, at big inflection points, you usually see more cross-asset changes.
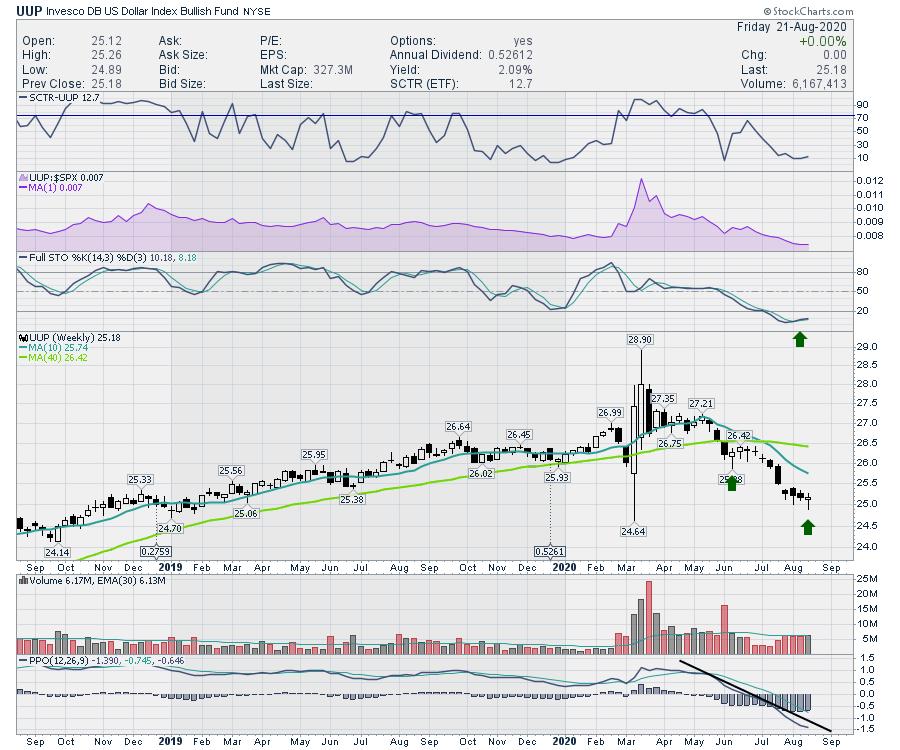
First of all, the almighty US Dollar is printing a hammer candle this week, a few weeks after the bonds did the same. A hammer candle is defined here. Typically used on a daily chart, the principle is the same on a weekly. Notice that the prior hammer candle did not mark a reversal. One of the differences on this hammer is that the full stochastic is turning up and has crossed above the signal line in tandem with the hammer. It is still too early to call it a trend change, but the downtrend has been in place with the entire rally. A change in the dollar would be a reason to suspect a change in the overall trend. It starts with a trend change in price action, and a hammer candle is a good example of an initiation move.
As the dollar is "oversold," a bounce here up to some moving averages, like the 10-week in blue or the 40-week in green, would be within a normal reversion.
All of a sudden, commodities are selling faster than french fries at McDonald's. A lithium name I was watching went from $12 to $9.50 in three days. Ouch! Another example might be the Gold miners testing their uptrend line on the GDX. Will Gold break down here or bounce and continue the uptrend? I'll be watching for changes in the commodities trend as well.
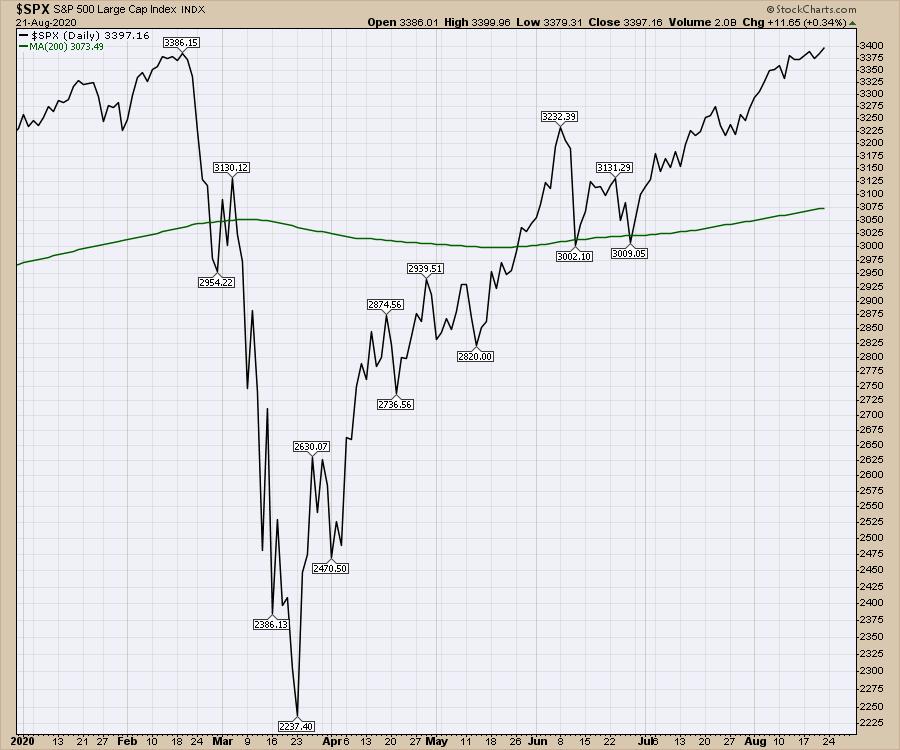
The second chart that is important is the $SPX. We are trying to break through prior highs. I like to watch the price action closely when we test prior highs. The market stalled at that level before, so now we want to watch and see if it has the strength to continue to new highs. What's not to like? It keeps pushing up.
Well actually, the advance/decline lines in various parts of the market are starting to break their uptrends. That could stall the $SPX. The advance/decline line is explained here.
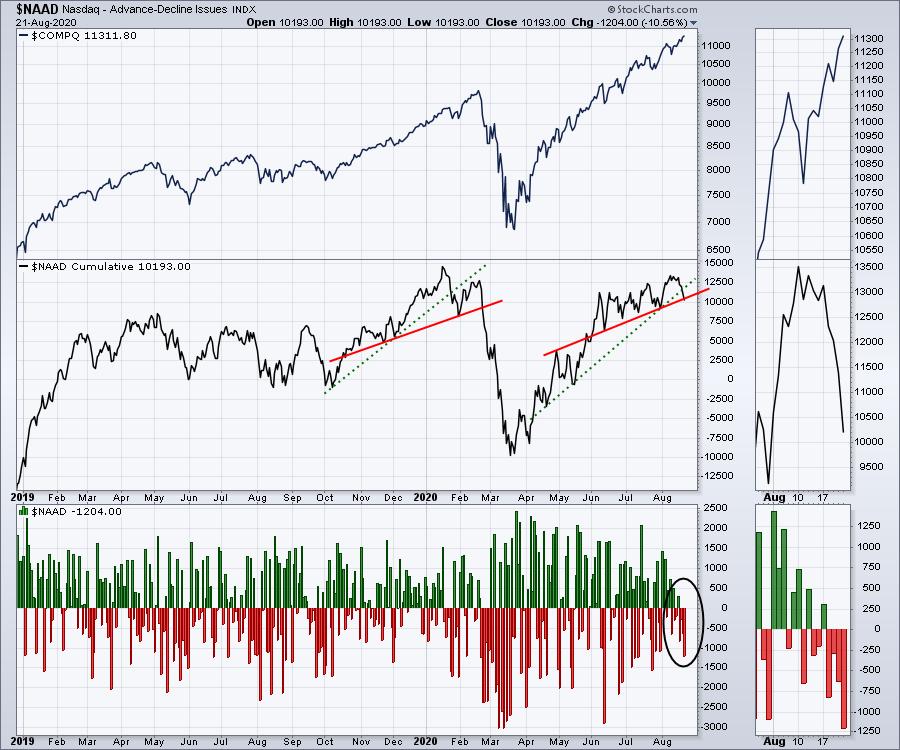
Below is the Advance/Decline line for the Nasdaq Composite (all the stocks on the Nasdaq exchange) in the second panel. As it is cracking this uptrend line, we are also on Options Expiration, which can be a meaningful day to expect (or at least watch for) trend changes. This is happening as the $SPX is trying to break out. What this means is that fewer Nasdaq stocks are helping the move up. While the Nasdaq looks unstoppable, trend line breaks in the advance decline line can be some of the early clues.
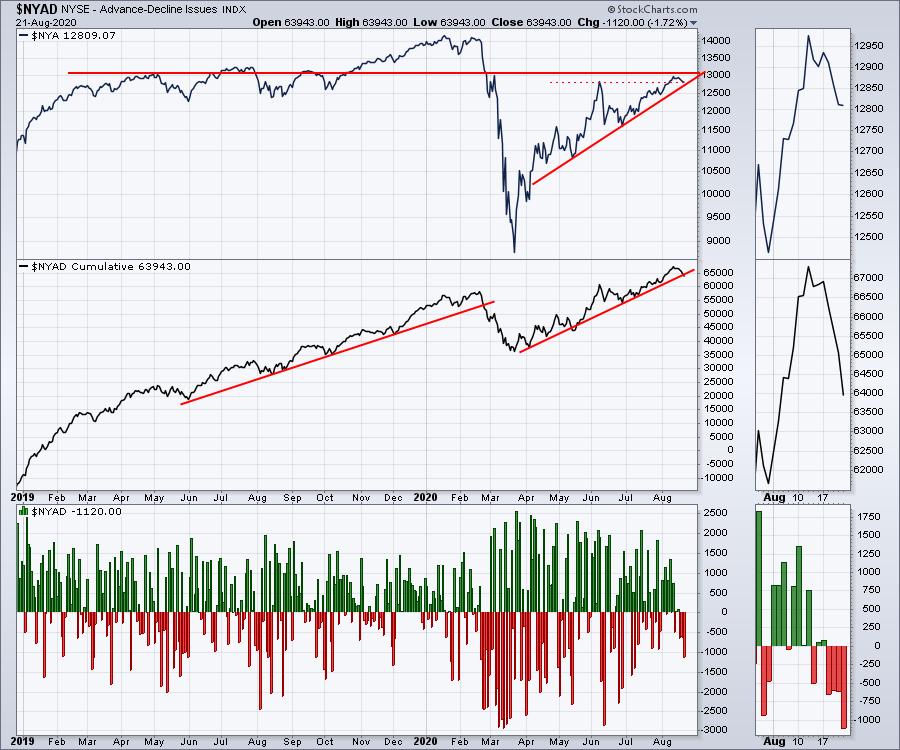
So the obvious question is what is happening on the other major US exchange, the New York Stock Exchange Composite? In the top panel, we see the NYSE Composite ($NYA). The stock exchange is at a resistance level that has stopped this $NYA index for most of 2019. After briefly breaking above the June highs, the market is now testing the uptrend line from the April lows. The problem, as we can see on the zoom panel, is that the number of stocks advancing compared to declining is plummeting, as shown on panel three. In panel two, we see the cumulative trend line breaking there as well. It is the break on the cumulative line that concerns me more.
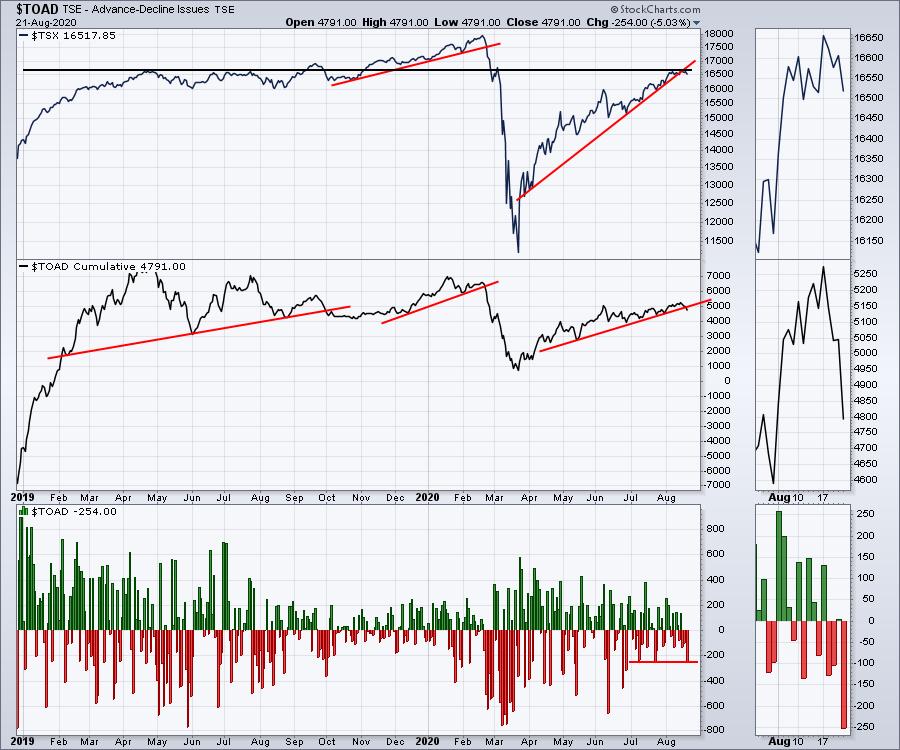
One other chart I like to use that is different from most technicians is the Toronto Stock Exchange advance/decline line. It represents a much smaller market in Canada, but smaller markets usually fracture or break before the US market. The Canadian markets advance/decline line is one that I would expect to break before or with the US market.
We can see that the Toronto Stock Exchange ($TSX - top panel) is stalled at the same level as most of 2019. We saw the same trend on the $NYA above. The advance/decline line in the centre panel is breaking as well, which adds a subtle confirmation of the break on the US market.
The breaks on all the advance decline lines have to reverse quickly to the upside next week, especially on the back of an options expiration this week. This all comes on the back of an article I wrote in my last ChartWatchers article about why it is important to watch price action closely around prior highs. That article is here - Ballistic Investing Heroes.
The $SPX is testing the prior high in price. The Canadian and NYSE Composite are stalling at the highs that were in place for much of the previous year. The Nasdaq is in an orbit of its own, as if nothing else matters. Maybe this is just a check back to the 50-day moving average on the $SPX before we go higher, but based on the underlying damage to the global economy, it's also a technical check for market euphoria.
Breakdowns in the advance/decline lines will need to follow through to the downside next week to confirm the first clues of a change in trend, but I won't be fully invested if they continue to break down. I have multiple other forms of breadth I follow and share with my subscribers that will be covered in depth in my newsletter this weekend. If you are interested, you can check out the member newsletter offering at GregSchnell.com.
Good trading,
Greg Schnell, CMT, MFTA
Senior Technical Analyst, StockCharts.com
Author, Stock Charts For Dummies
Want to stay on top of the market's latest intermarket signals?
– Follow @SchnellInvestor on Twitter
– Connect with Greg on LinkedIn
– Subscribe to The Canadian Technician
– Email at info@gregschnell.com


