The technology sector sparks a lot of interest, and for good reason - it has turned into a safe(r) haven when things get rough in the markets, but it's also everybody's baby when the market goes up. "What could possibly go wrong?", one would think. The answer, IMHO, is nothing - and also a lot!
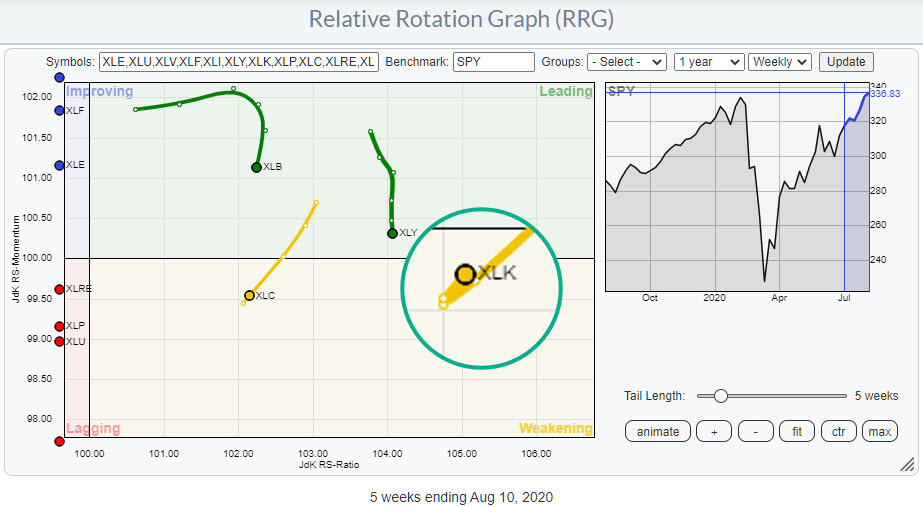
On the weekly Relative Rotation Graph for US sectors, XLK is still the highest ranking sector measured on the JdK RS-Ratio scale. This makes it the sector with the strongest relative trend in the universe. The tail on XLK was showing a downward rotation into the weakening quadrant for a few weeks. But, as we know, such a rotation at high RS-Ratio values is usually a temporary pause within the longer-term rising trend.
Reading from that weekly RRG for US sectors (see inset), that seems to be the case... again. Inside the magnified circle you see the tail of XLK moving further into the weakening quadrant at a weak RRG-Heading but hooking back up again. This move was fed by the strong rotation for the Technology sector at the start of this week (article).
So, all in all, Technology continues to throw curve balls.
A Look Behind the Scenes
That's enough reason to take a look behind the curtain and investigate what is going on among the components of this sector.
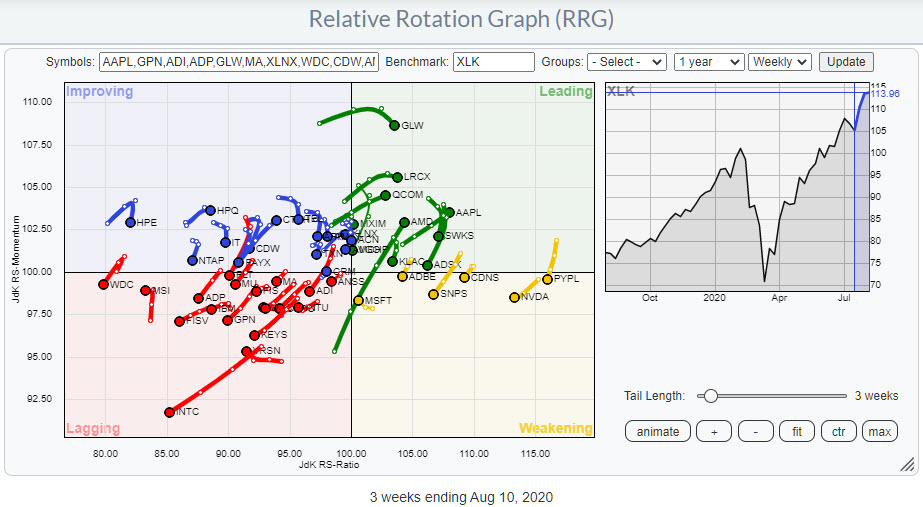
The RRG at the top of this article shows the weekly RRG for all XLK components. To understand how relative rotation and relative strength works, it's important to know how a sector is put together and especially if there are any "heavyweights" in there. We discussed the dominance of AMZN inside the Consumer Discretionary sector a few times recently, but Technology also has a few heavy weight names.
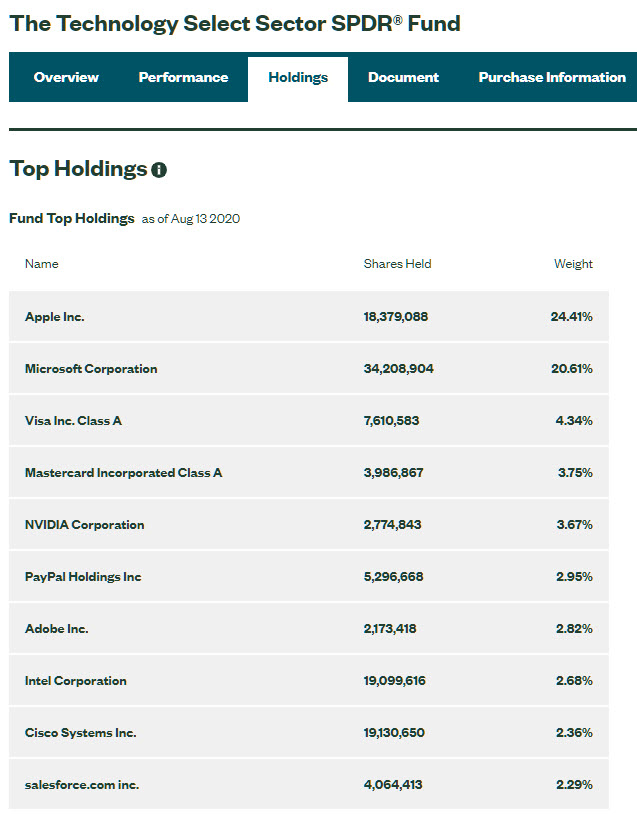 You can find the composition for all these sector ETFs on the SPDRS.com website. Click on the image on the left to visit the page for XLK on the SPDRS website, where you can find all information for this ETF, including the composition.
This sector has just over 70 members (stocks) but, as you can see in the table, AAPL and MSFT together are already 45% of the index and the top-10 holdings account makes up almost 70%!!! That basically means that whatever happens to these two or ten names will be driving the direction of the sector.
The RRG at the top of the article holds the top 50 names of XLK. There is a hard cut-off at 50 symbols on a Relative Rotation Graph. Otherwise, the plot would become too crowded.
On the aforementioned RRG, you can see that the majority of the stocks are located at the left-hand side of the graph, either in the lagging or the improving quadrant. And you can also see that there are more tails traveling at an RRG-Heading between 180-270 than between 0-90.
If you would like to see the rotations of its members as some sort of a breadth measure for the sector, I'd say it is negatively skewed. But price is still moving higher, and so is relative strength vs SPY.
There is only one possible explanation for that: the big names are doing really well. In order to investigate this further, I have set up an RRG that only shows the top-10 members vs. XLK.
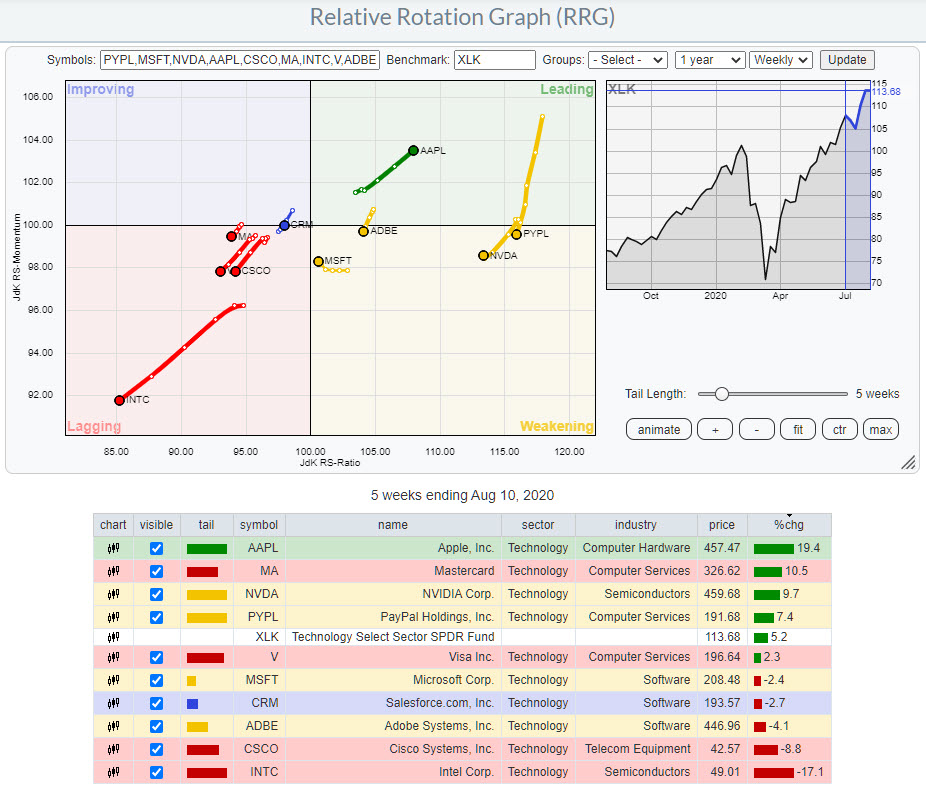
Here, we see that the majority of this group is located at the right-hand (positive) side of the graph while only four tails are moving into the lagging quadrant. The AAPL tail is solidly progressing further into the leading quadrant, whereas MSFT has started to curl up inside the weakening quadrant already.
So the big guns are still holding up their relative strength. The only real dissonant here is INTC, which is rapidly moving away from the group deeper into the lagging quadrant. However the weight for INTC is only one-tenth of the weight for AAPL and MSFT, so the INTC move is not nearly strong enough to drag XLK down vs. the market and the small loss for MSFT in this period is not meaningful enough to be harmful.
The essential takeaway here is that, with top-heavy sectors like XLK, it is important to keep an eye on the rotation for individual members and pay attention when the dominant stocks, in this case MSFT and AAPL, are starting to move, as that will drive the move for the sector as well.
As long as the heavyweights continue to do well, all will be good. Once they start to turn, a lot can go wrong.
#StaySafe, --Julius
My regular blog is the RRG Charts blog. If you would like to receive a notification when a new article is published there, simply "Subscribe" with your email address.
Julius de Kempenaer
Senior Technical Analyst, StockCharts.com
Creator, Relative Rotation Graphs
Founder, RRG Research
Host of: Sector Spotlight
Please find my handles for social media channels under the Bio below.
Feedback, comments or questions are welcome at Juliusdk@stockcharts.com. I cannot promise to respond to each and every message, but I will certainly read them and, where reasonably possible, use the feedback and comments or answer questions.
To discuss RRG with me on S.C.A.N., tag me using the handle Julius_RRG.
RRG, Relative Rotation Graphs, JdK RS-Ratio, and JdK RS-Momentum are registered trademarks of RRG Research.


