 The Bollinger Band squeeze signals a volatility contraction that can lead to a volatility expansion. But which way? For directional clues, we need to analyze price action and other indicators. Henry Schein caught my eye because the stock has a Bollinger Band squeeze, a bullish chart pattern, an uptrend and a strong sector. That's a potentially powerful combination.
The chart below shows HSIC with the Bollinger Bands in pink and at their narrowest since February. This means volatility contracted and we should prepare for a volatility expansion. In other words, prepare for a move.
As far as directional clues, the long-term trend is up because price is above the 200-day SMA. The sector is also strong as the Healthcare SPDR (XLV) recorded a 52-week high earlier this week. This suggests that the path of least resistance is up.
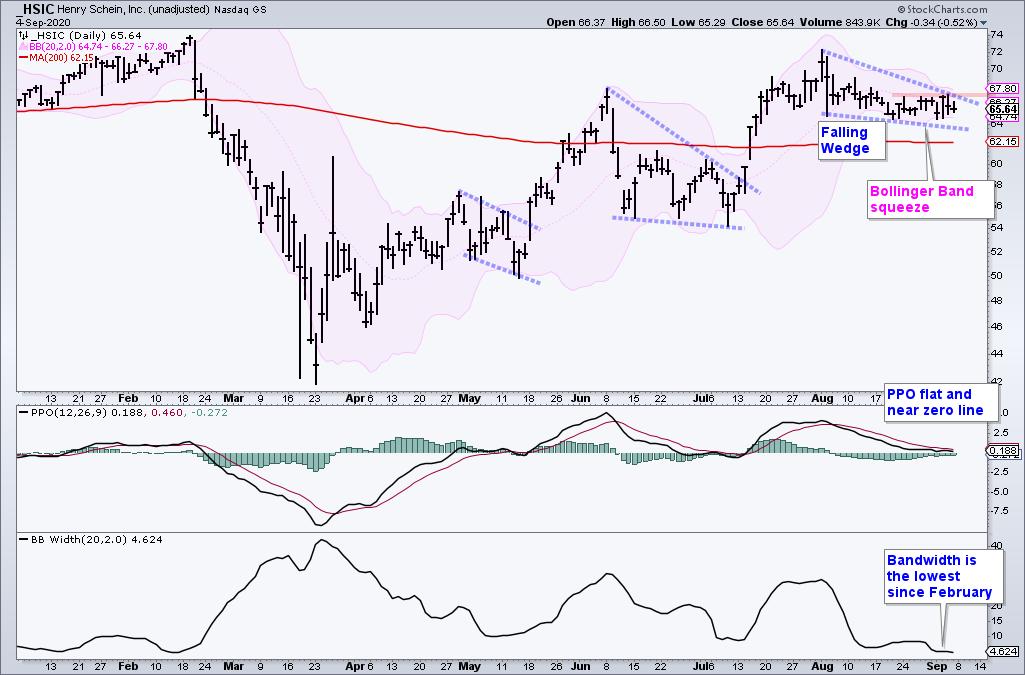
The price chart also sports a bullish corrective pattern, the falling wedge. The stock advanced from late March to early August and then fell back with the falling wedge the last five weeks. This decline retraced 38-50% of the prior decline and price is holding above the 200-day. The retracement amount and the pattern are typical for corrections within bigger uptrends.
Now what? The immediate trend is down as long as the wedge falls and the PPO remains below its signal line. Watch for a breakout at 68 and an upturn in the PPO to reverse this fall. A breakout would end the correction and signal a continuation of the bigger uptrend.
This week at TrendInvestorPro we unveiled a new chartbook that features long-term and short-term breadth models for the S&P 500, Nasdaq 100, S&P 100, S&P MidCap 400 and S&P SmallCap 600. Combined with the trend indicators, these models can keep investors and traders on the right side of the trend.
Click here to take your analysis to the next level!
--------------------------------------
Choose a Strategy, Develop a Plan and Follow a Process
Arthur Hill, CMT
Chief Technical Strategist, TrendInvestorPro.com
Author, Define the Trend and Trade the Trend
Want to stay up to date with Arthur's latest market insights?
– Follow @ArthurHill on Twitter


