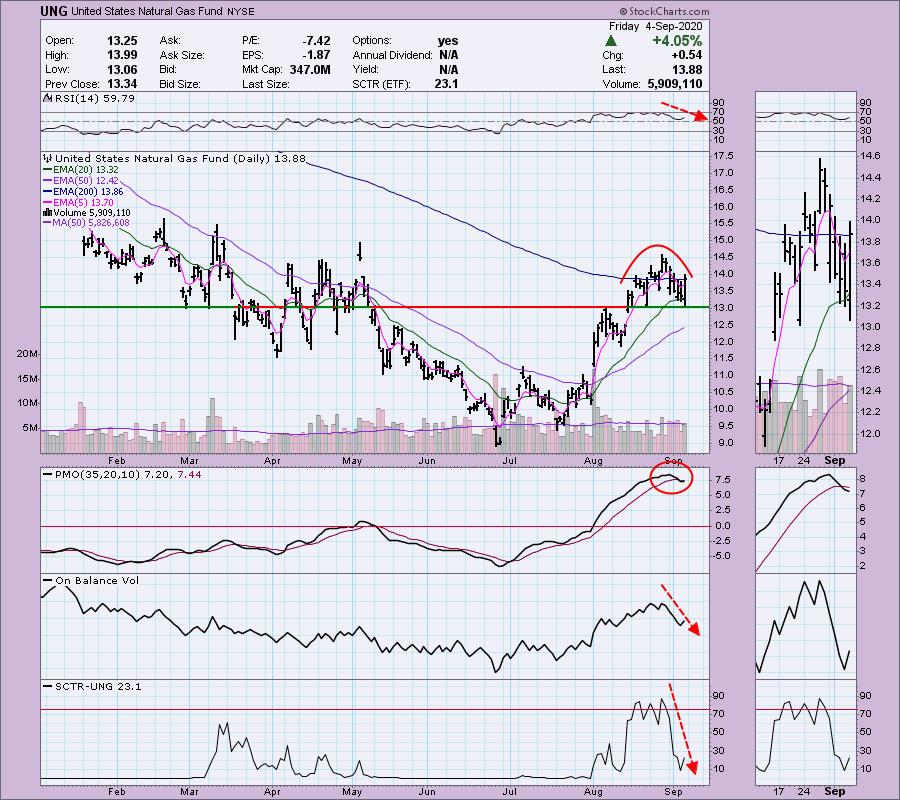
It may seem strange to write a negative review of an ETF after it just made a 4%+ move today, but I wrote to my subscribers earlier this week about the bearish warning signs on Natural Gas (UNG). While admittedly I'm not quite as bearish, given the price action today and the shift in the RSI, there are still bearish warning signs. If you recall, I wrote about UNG in ChartWatchers back on July 24th and then again for my Diamond subscribers on July 26th after the big drop, giving them an even better entry. I know many of them pulled the trigger and so I decided to let them (and you) know there are problems on the UNG chart.
Back to UNG: The PMO has triggered a crossover SELL signal in very overbought territory. The RSI is looking okay now, but I don't like the configuration of the OBV and SCTR, which dove much much lower. If you do own it, that $13.00 level is a good "line in the sand." It held up today and, if it holds up going into next week with improving volume, it should be a good hold. The 50-EMA could also provide support, but, if that $13 level is lost, I expect you'll see more selling.
Be sure to read all the way through today's article to see my "Sector to Watch" and my ChartWatchers "Diamond of the Week", which was presented yesterday exclusively to my Diamonds subscribers.
Every Friday, when I write the DP Diamonds Report Recap, I pick a sector (or two) that we should watch in the coming week. It gives me some direction as to where I want to "mine" for my Diamonds in the coming week.
I like Financials (XLF) going into next week and I will continue to monitor the Energy sector -- when money begins rotating to Energy, you can bet I'll be looking for bargains for my Diamonds subscribers.
However, my top pick for next week is the Materials sector (XLB). I wrote about the rotation out of technology and what appears to be rotation into materials. The chart below is from our Sector ChartList (subscriber-only) on the DecisionPoint.com website. Carl does the annotations and updates them daily on all three of our DecisionPoint.com ChartLists!
What I love about our sector charts is that all of the pertinent indicators are there, including our newest... the Silver Cross Index (SCI) and Golden Cross Index (GCI). The SCI measures the %stocks that have a 20-EMA above their 50-EMA (silver cross) and the GCI measures %stocks that have their 50-EMA above their 200-EMA (golden cross). Notice the positive confirmations on most of these indicators. We are seeing greater participation based on the %Stocks indicators. Additionally, the BPI, SCI and GCI are all confirming the rotation into Materials. Strength is building in this sector.
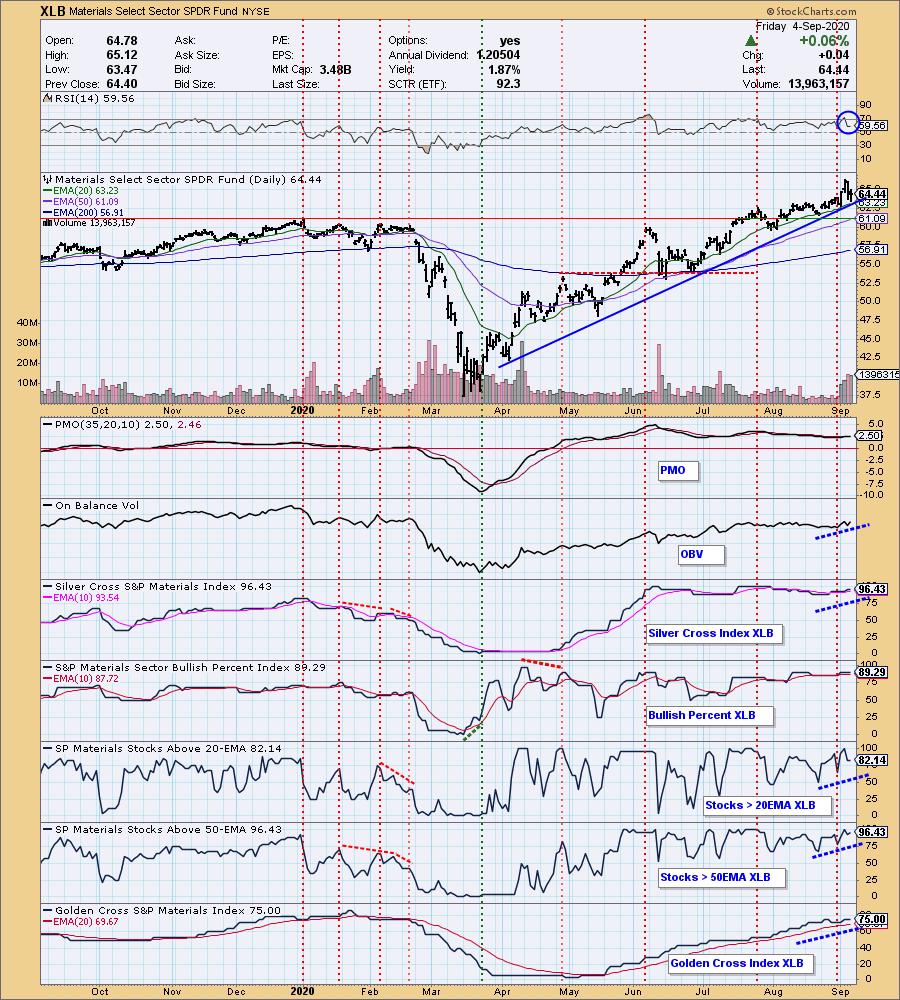
Conclusion: UNG is acting "toppy," so keep an eye on the $13.00 support level! Materials (XLB) looks like the sector I'll be watching this week for Diamonds. I just finished up my DP "Diamond Mine" trading room this morning for Diamonds subscribers only. This intimate trading room is fantastic and is certainly worth the price of admission by subscribing to our Diamonds Reports. We examined the Diamonds presented this week and symbols to watch in the coming week. I cover how to enter and exit stocks to improve your trading.
We also just started our FREE DecisionPoint LIVE Trading Room on Mondays at noon ET. Details on registering for the Trading Room are below! Read on for the ChartWatchers "Diamond of the Week".

Register for the Free Trading Room at this link or click above. Our next session is on 9/14/2020!
DecisionPoint Diamonds are becoming even more indispensable! Not only do you get 60 "Diamonds in the Rough" stocks/ETFs per month, with complete analysis including stops/targets... but there will now be a Friday Diamonds Recap that will look at the performance of each week's Diamonds and their prospects moving forward. Over the weekend, we clean the slate and start over again.
Included for my Diamonds subscribers only will be a new one-hour trading room, "The DecisionPoint Diamond Mine" on Fridays! It will provide an opportunity for us to talk live, review current and past Diamonds for possible entries/exits/stops/targets and take your questions and symbol requests in this intimate trading room.
DecisionPoint Alert subscribers will continue to enjoy clear, concise analysis of the overall market, including Dollar, Gold, Gold Miners, Oil and Bonds from both Erin and Carl Swenlin. You will be prepared each market day knowing the implications of market behaviors for that day, week or month!
All subscribers have access to our exclusive ChartLists that are annotated and curated by Carl Swenlin. Know what he thinks is important for all of the sectors, indexes, indicators and more!
Today's ChartWatchers "Diamond of the Week":
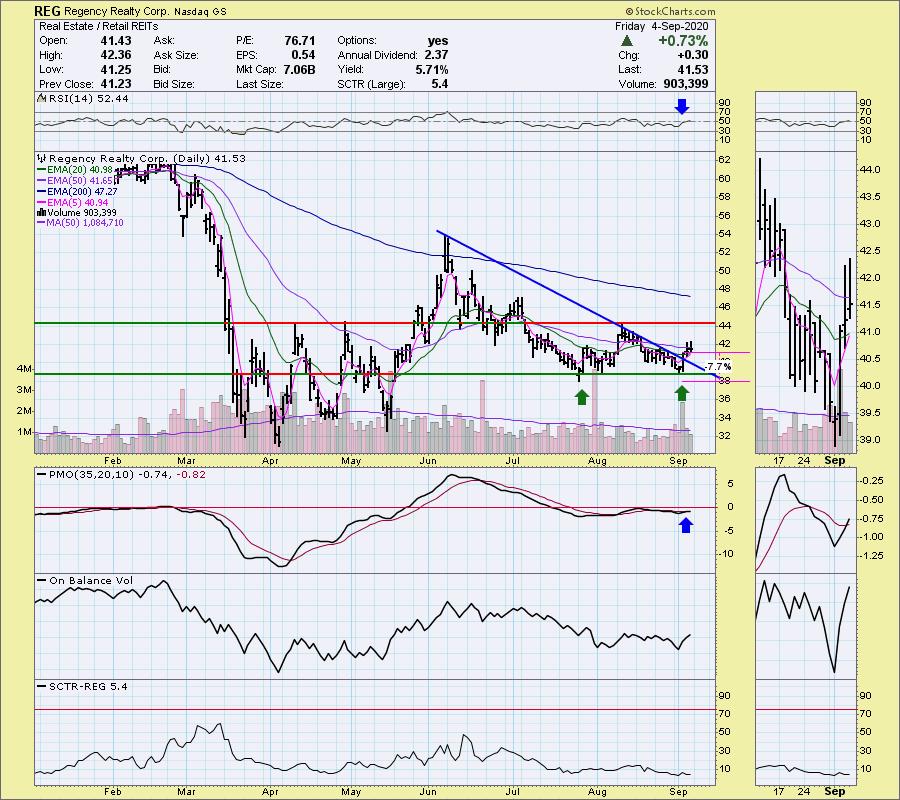
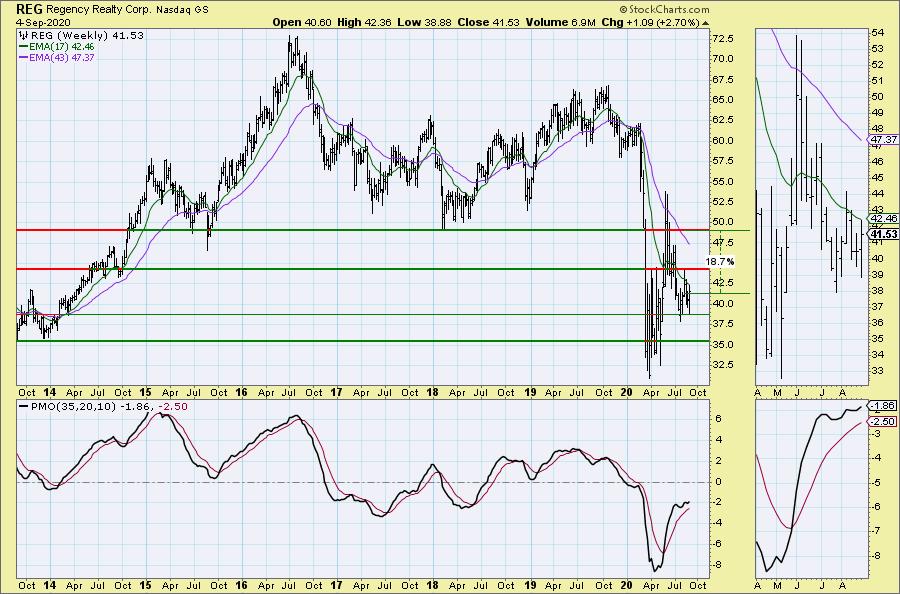
This "Diamond in the Rough" selection is from the September 3, 2020 DecisionPoint Diamonds Report. I have included the chart from Thursday with my original comments, after which I follow up with the current chart.
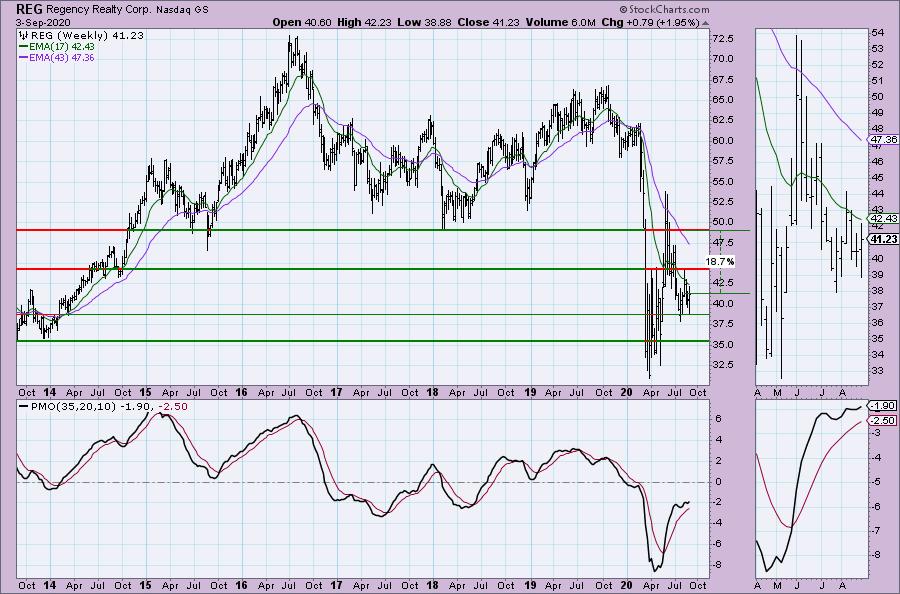
Regency Realty Corp (REG)
EARNINGS: 10/28/2020 (AMC)
Regency Centers Corp. operates as a real estate investment trust, which engages in the ownership, operation, and development of retail shopping centers. Its portfolio includes thriving properties merchandised with highly productive grocers, restaurants, service providers and best-in-class retailers that connect to its neighborhoods, communities and customers. The company was founded by Martin Edward Stein, Sr. and Joan Wellhouse Newton in 1963 and is headquartered in Jacksonville, FL.
Alright, this is my Diamond pick today. As I noted in the opening, Real Estate has perked up and, since it is generally considered part of the "defensive" area of the market, this could do well if the market continues lower. If the market rebounds, the setup is pretty good and you'll also have a reasonable stop in place. The PMO has turned up and the RSI just moved into positive territory. Volume is coming in on REG and we could be looking at a double-bottom coming off the correction experienced in June/July. I don't like that SCTR, but price is well below the 200-EMA, so not a surprise. Sometimes that is the price you pay for a beat-down candidate.
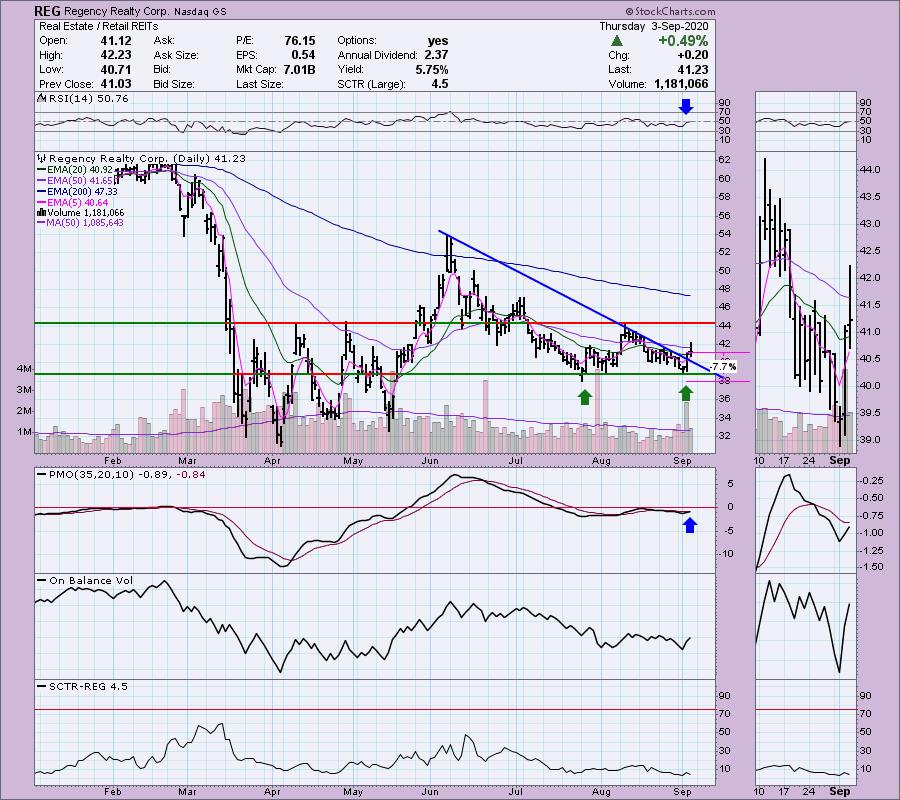
FRIDAY's CHART:
I was pleasantly surprised when I saw the weekly chart had a rising PMO that was making a move toward positive territory. I've made a conservative upside target based on the 2018 low; however, the 2020 high is certainly attainable if REG starts to rally big time.
FRIDAY's CHART:
TRY US OUT! Don't forget, you can give our reports a try with a 1-week free trial by subscribing to the "Bundle" package and using coupon code: dptrialcw.
Happy Charting! - Erin
Technical Analysis is a windsock, not a crystal ball.
Helpful DecisionPoint Links:
DecisionPoint Alert Chart List (subscribers only)
DecisionPoint Golden Cross/Silver Cross Index Chart List (subscribers only)
DecisionPoint Sector Chart List (subscribers only)
Price Momentum Oscillator (PMO)
Swenlin Trading Oscillators (STO-B and STO-V)


