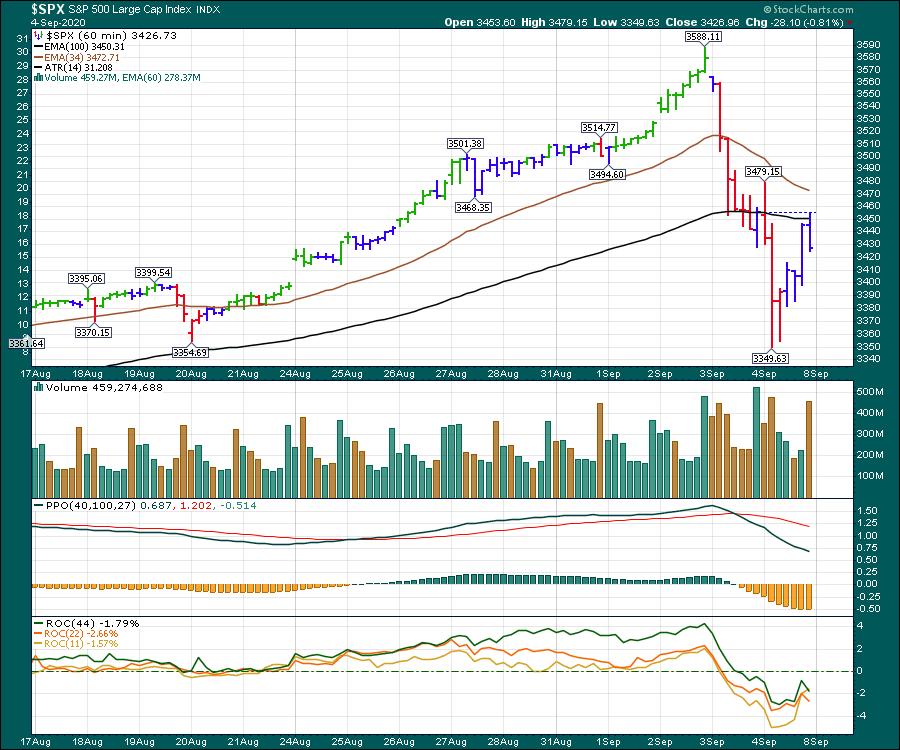
In high school, my CB- Radio handle was carrot-topper. As a chartered market technician, we talk about rounded tops and v-bottoms. But the last three stock market tops have been more like solitaire-diamond tops protruding up and priced for perfection. We've come a long way from the March bottom and, this week, the big price drop Thursday and the wild oscillations Friday have considerably slowed the momentum.
The NASDAQ 100 was even more severe in its reversal. I broadened this chart out and you can see the change in momentum shown by the PPO.
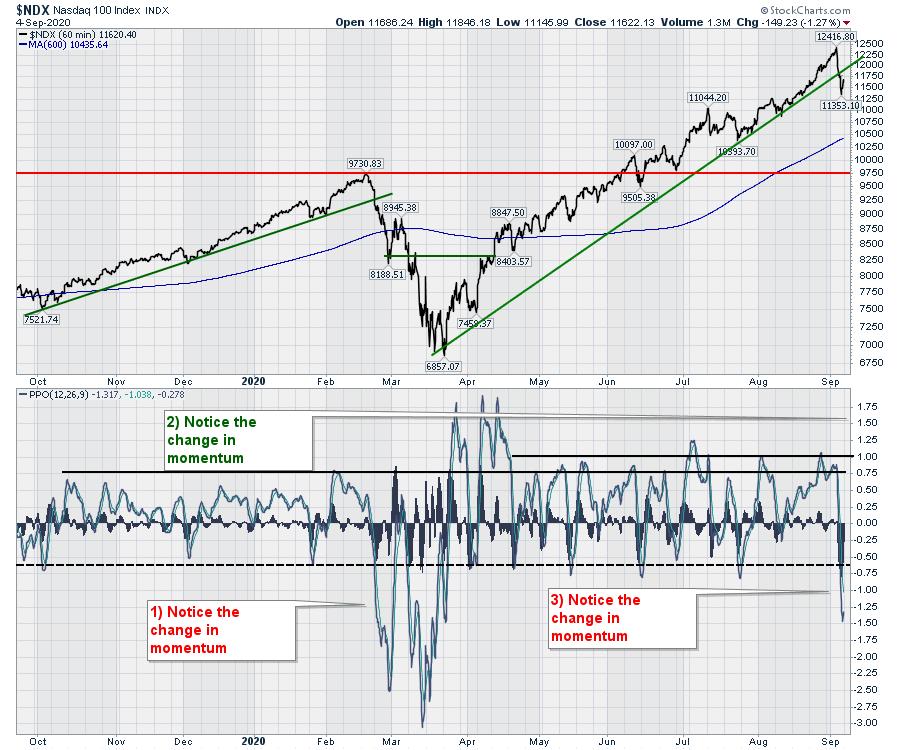
If the tops are going to be carat tops now, I'll need to be changing my expectations for a topping structure. While my faster indicators were breaking down, my regular topping indicators still have a ways to go. Perhaps that means we'll still get a rally back up to test the highs and then fall away?
There is no doubt the market was frothy, but the market can go higher than we expect, and I think this was a good example of continuing to march up and up.
As we settle in for the final 60 days of the US election cycle, can the market propel higher?
The 2016 market cycle was weak for the two months leading into the election cycle, with a quick drop in early September as well. The red line is 60 days out and the dotted line was the election.
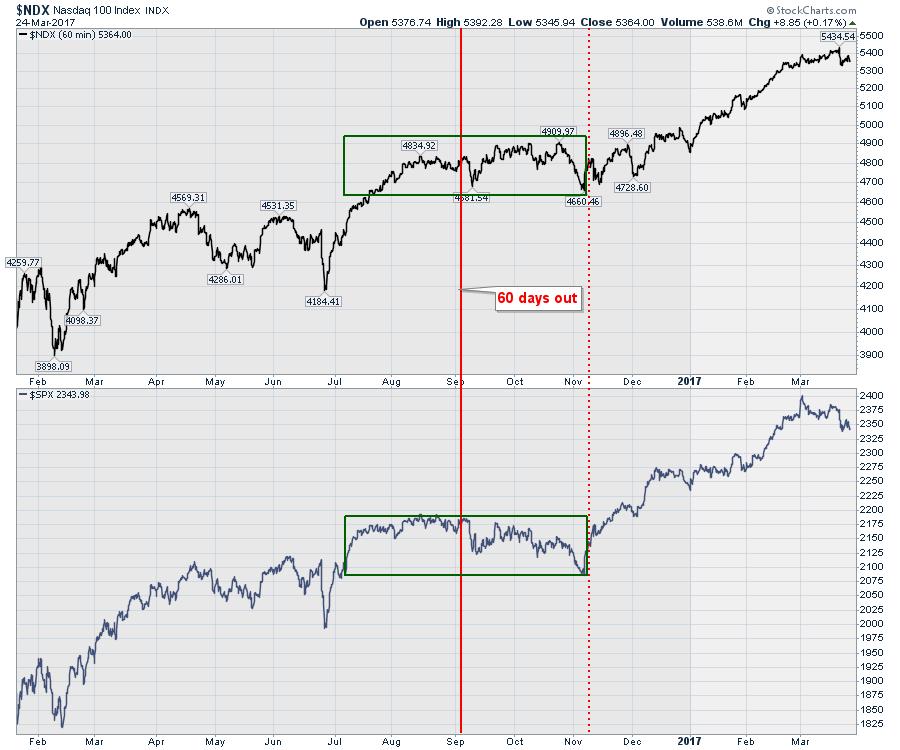
I am not a huge seasonality fan, but a 4-8 week correction could give the market a chance to consolidate here and set a leg higher in the usually bullish fourth quarter and 1st quarter of 2021.
Next week, I'll be announcing a September 30th presentation on StockCharts TV. This will be focused on being prepared for one of the biggest swings coming at us. Stay tuned for a link to the registration page and I hope to see you there!
Good trading,
Greg Schnell, CMT, MFTA
Senior Technical Analyst, StockCharts.com
Author, Stock Charts For Dummies
Want to stay on top of the market's latest intermarket signals?
– Follow @SchnellInvestor on Twitter
– Connect with Greg on LinkedIn
– Subscribe to The Canadian Technician
– Email at info@gregschnell.com
