"Great chart, but it seems super short-term. When would you get out of this?"
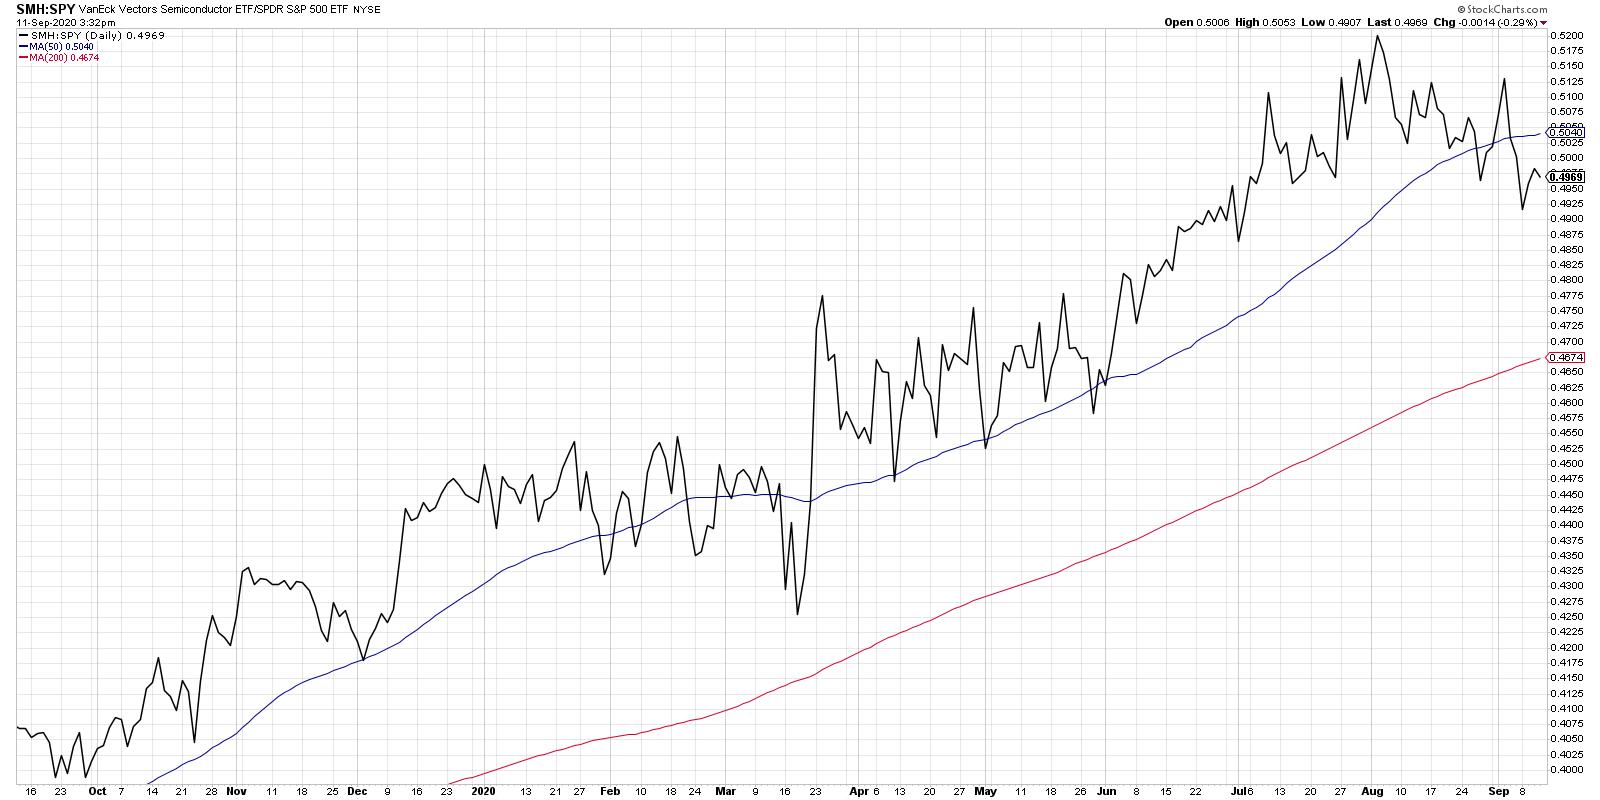
That was the reaction I received on social media when I posted this chart showing the relative strength of semiconductors to the S&P 500.
In terms of my process, I focus my macro perspective on three stages: price, breadth and sentiment. Price is most important of all, as it tells you how people are voting with their capital. Are investors buying stocks or bonds? Gold or energy stocks? Homebuilders or medical equipment names? The price charts can answer all of those questions.
Here's the challenge. Technical analysis often focuses on the tools you use to analyze one particular chart, one particular asset, one particular trade. But how do you know if you're looking at the right chart in the first place? That's where ratio charts come in.
For me, relative strength is a vital step in the decision-making process. They are how you determine how this particular stock relates to all other names you could be buying or selling at any given moment. To be clear, I'm talking about relative strength here (i.e. this stock versus other stocks) as opposed to the Relative Strength Index, which is a measure of price momentum.
One of my ChartLists is filled with ratio charts, which essentially apply the discipline of relative strength investing to a bunch of different combinations of ETFs and asset classes. This allows me to see whether investors are leaning more into offense (Consumer Discretionary) or defense (Consumer Staples), for example.
Now let's get back to the chart of semiconductors vs. the S&P 500 index.
I have found the relative performance to be a key market tell, in that semiconductors over time have become more of a central component to the success of the economy. Much like Charles Dow used the Dow Industrials index to track the health of the economy, I would argue that, at this point the semiconductors group may be the best broad market indication.
When the economy is doing well, when things are growing and people are buying, that should be reflected in the performance of semiconductor names. Recently, we've seen a bit of a rotation away from semiconductors, as this ratio has gone from a confirmed uptrend (higher highs and higher lows) to a confirmed downtrend (lower lows and lower highs).
What's my time frame? Where would I initiate a short position? What would be my risk management if the price went higher? All of those questions I would answer, mainly, with a chart of the SMH to better understand the price dynamics and identify potential entry and exit points.
My friend Dave Landry recently pointed out that "Indicators are Illustrators," meaning that he uses technical indicators more to visualize the price dynamics and less for actual execution, which is based on price itself.
I tend to think of ratios in the same way. They give you a broad sense of when investors are leaning into one side or the other of a relationship. They speak to potential leadership rotation, especially at turning points.
The ratio in today's chart turning lower tells me that a leadership rotation is occurring now. And it tells me to focus on individual price charts of the SMH, as well as names like AMD, AVGO, KLAC and others, to analyze price trends and manage potential downside risk.
David Keller, CMT
Chief Market Strategist
StockCharts.com
Disclaimer: This blog is for educational purposes only and should not be construed as financial advice. The ideas and strategies should never be used without first assessing your own personal and financial situation or without consulting a financial professional.
The author does not have a position in mentioned securities at the time of publication. Any opinions expressed herein are solely those of the author and do not in any way represent the views or opinions of any other person or entity.


