Years ago, before online charting platforms were widely available, technicians resorted to chartbooks published on a weekly or monthly basis and received days later in the snail mail. Using their long-term perspective helped a lot of us to appreciate that surpassing Dow 1,000 (see Chart 1) was a really big deal.
The reason for this lay in the fact that, for close to 20 years, this popular average had tried five times to clear the magic 1,000 level. Each time was rebuffed. If the Dow had broken out on its own, that would have been one thing; however, in reviewing our chartbooks, it was obvious that it had plenty of company, as many key stocks and sectors were either breaking out from large consolidation patterns or bases or on the verge of doing so. It's a technical principle, of course, that the bigger the base, the greater the magnitude and duration of the subsequent price move is likely to be. When a lot of stocks and averages are acting in a similar fashion, it just adds to the strength and credibility of the rally.
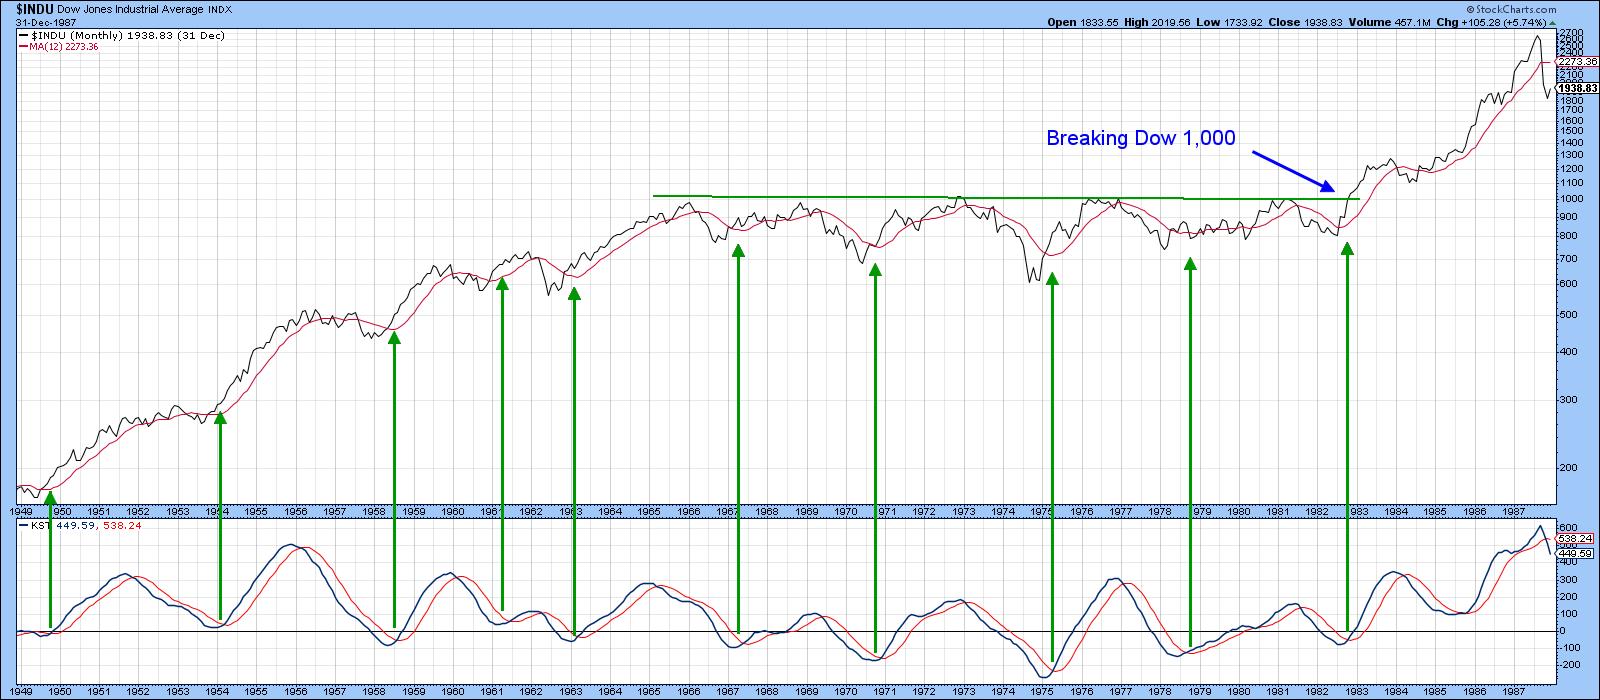 Chart 1
Chart 2 tells us that no such base is currently forming, the last decade having experienced an almost linear type of advance. One thing we can say is that the long-term KST has just triggered its fifteenth low risk buy signal since 1949. All the others were followed by a bull market. Need I say more?
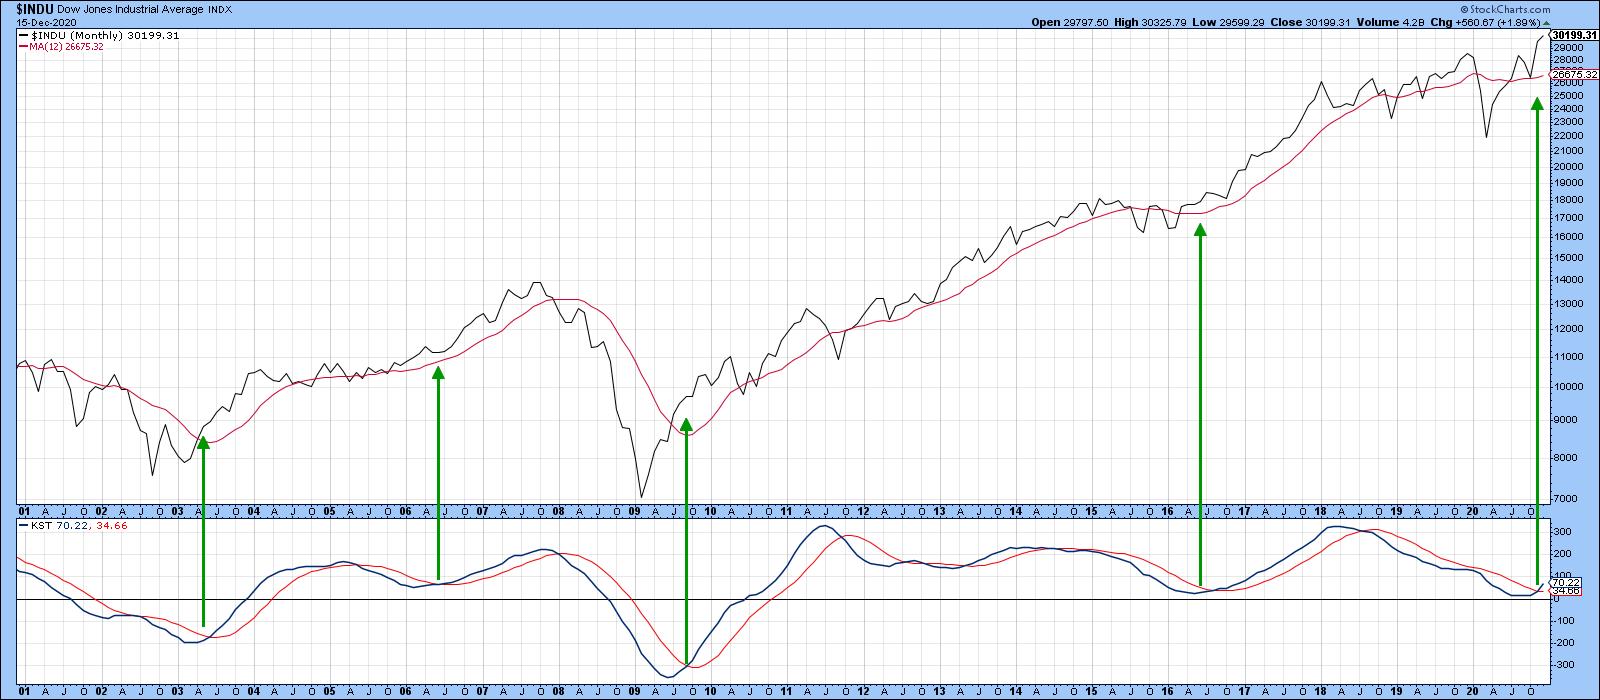 Chart 2
It's only when we turn to the global equity scene that similar base-building characteristics to the 1966-1982 US experience are apparent. In effect, there are some global charts that suggest something big could be in store for 2021 and beyond.
Chart 3 features an inflation-adjusted Dow Jones World Stock Index, where it is possible to construct a trendline connecting the 2000, 2007, 2018, 2019 and early 2020 peaks. That's not as clear a level of resistance as we had for Dow 1,000. Nonetheless, it still represents an obvious dynamic barrier of resistance. That resistance was cleared at the end of November, triggering a newly-minted long-term KST signal. The momentum signal in and of itself would normally be expected to have a positive effect for a year or two. However, the upward penetration of the trendline is closer to the significance of the Dow breaking 1,000. In other words, the KST will help validate the upside breakout, but the penetration of the line is what signals the likelihood of a forthcoming multi-year advance.
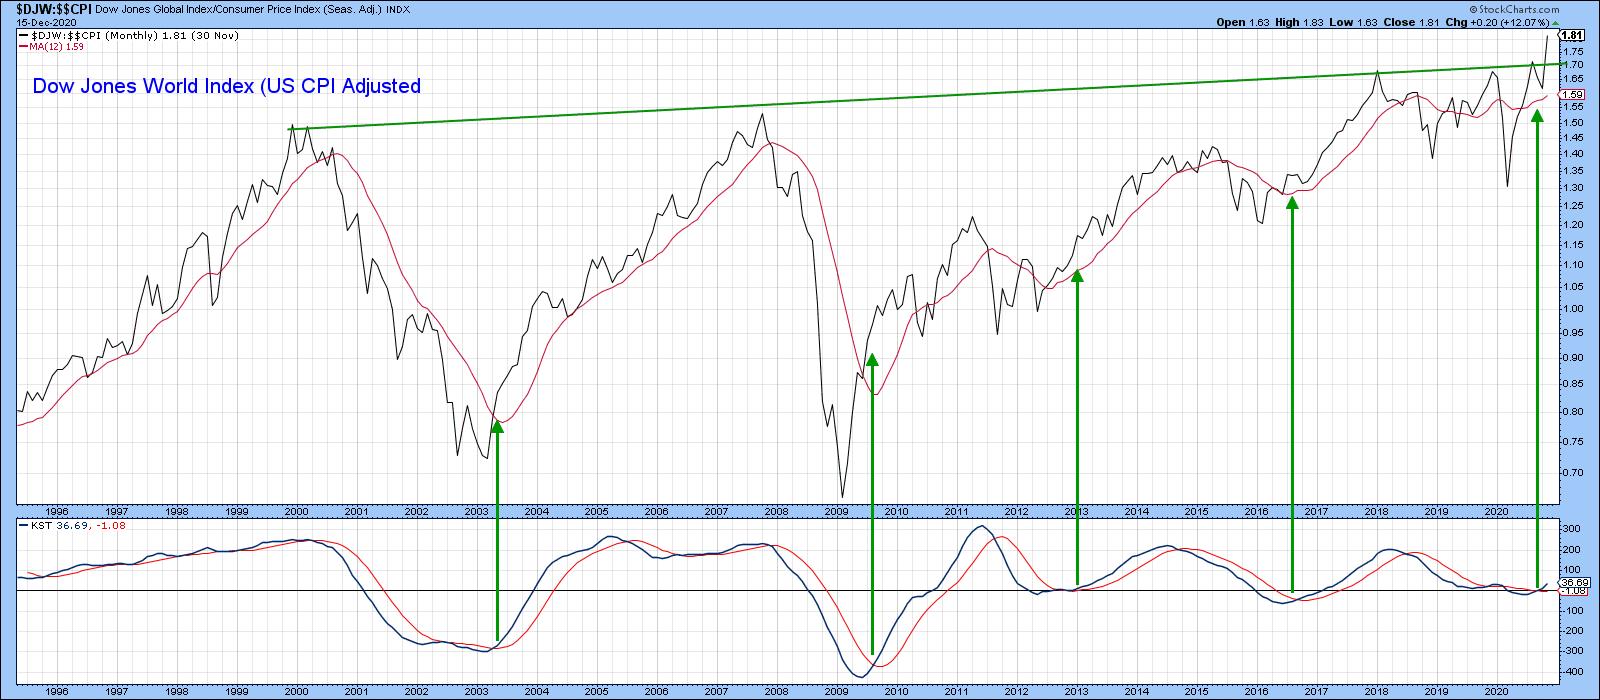 Chart 3
Europe
European stocks have been dragging since the year 2007, when the Dow Jones Europe Index peaked. Since then, it has been caught in a large trading range and is now in the process of challenging its previous highs. There are several reasons for expecting it to go through. First, the long-term KST has just gone positive. Second, the World Index has already broken to the upside.
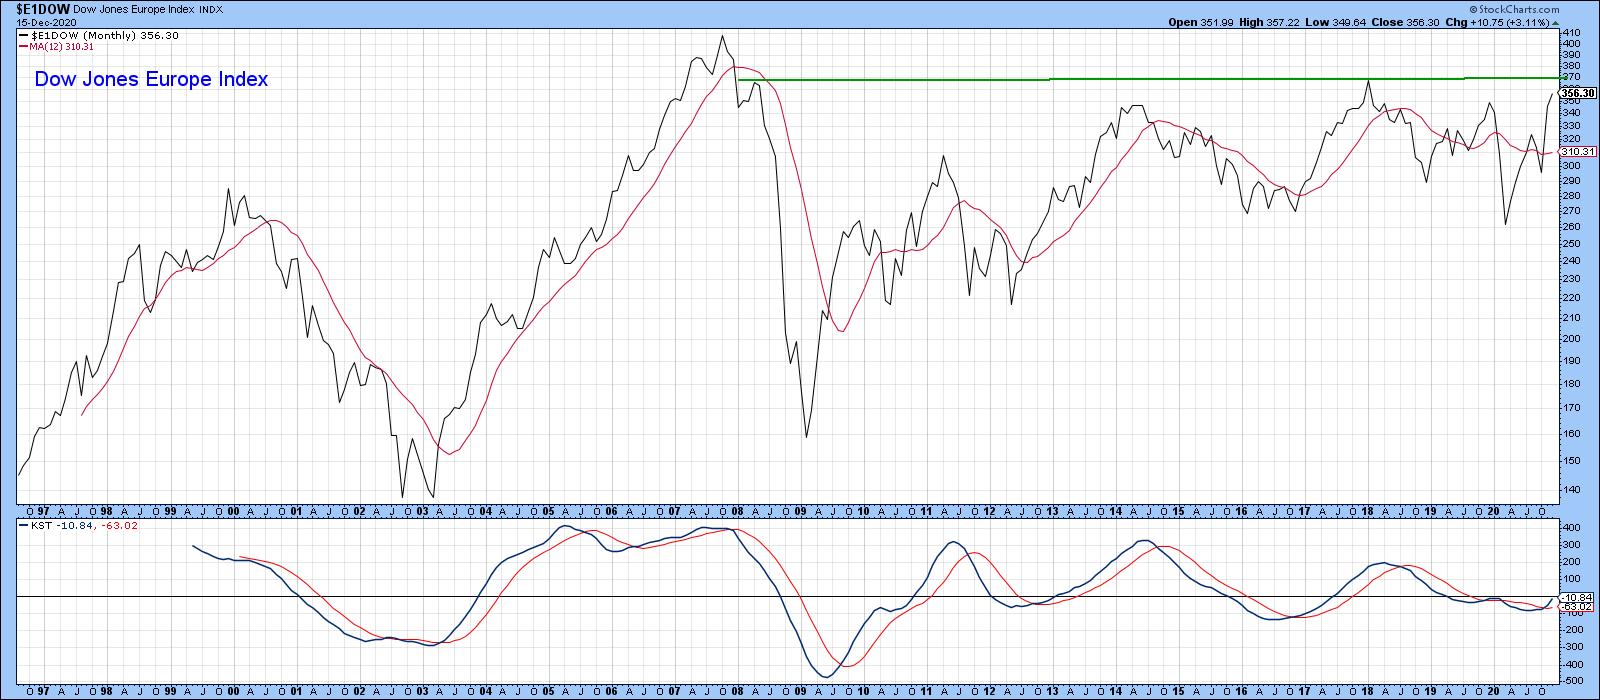 Chart 4
Finally, Chart 5 shows that the Nordic part of Europe is already leading the way higher.
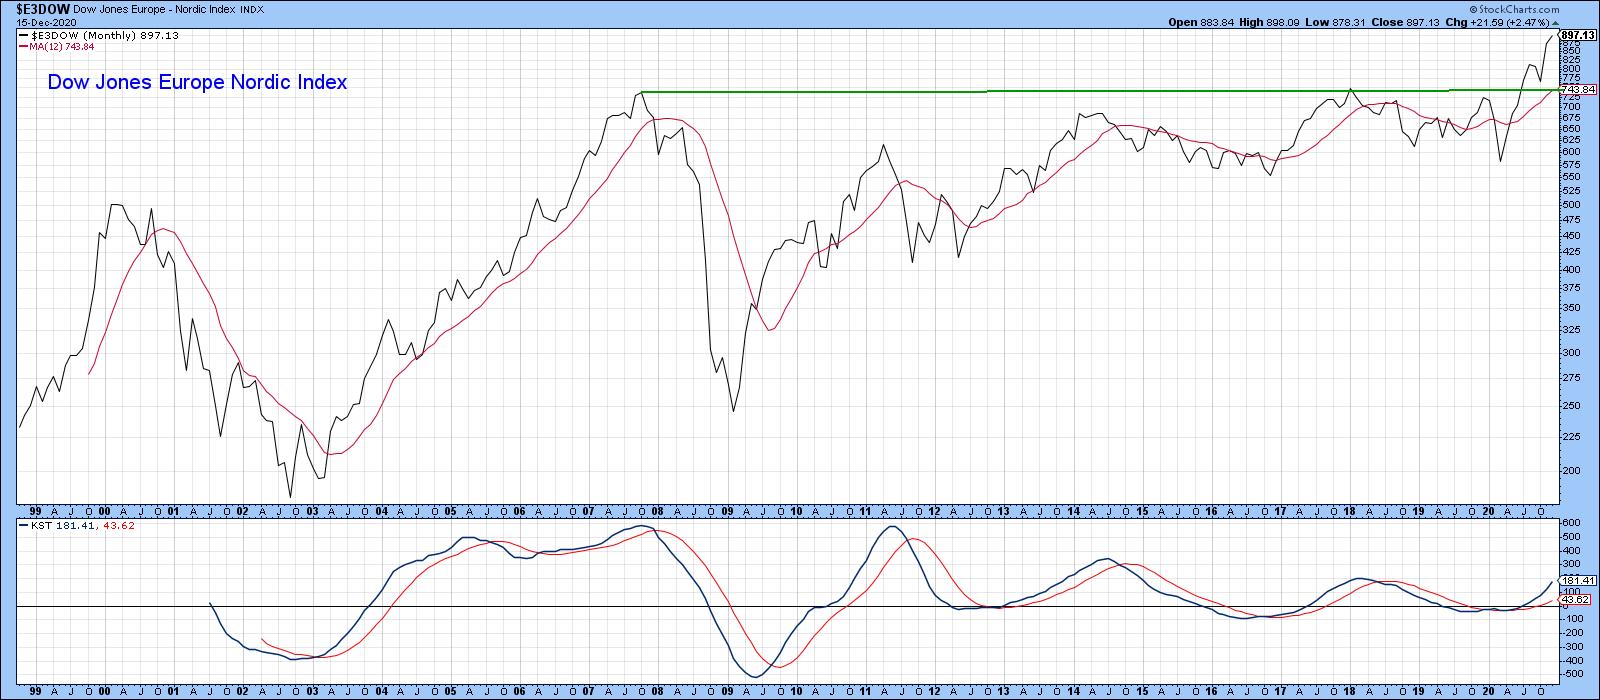 Chart 5
Two countries that are right on the brink of an upside resolution of a giant trading range are Germany (Chart 6) and Italy (Chart 7).
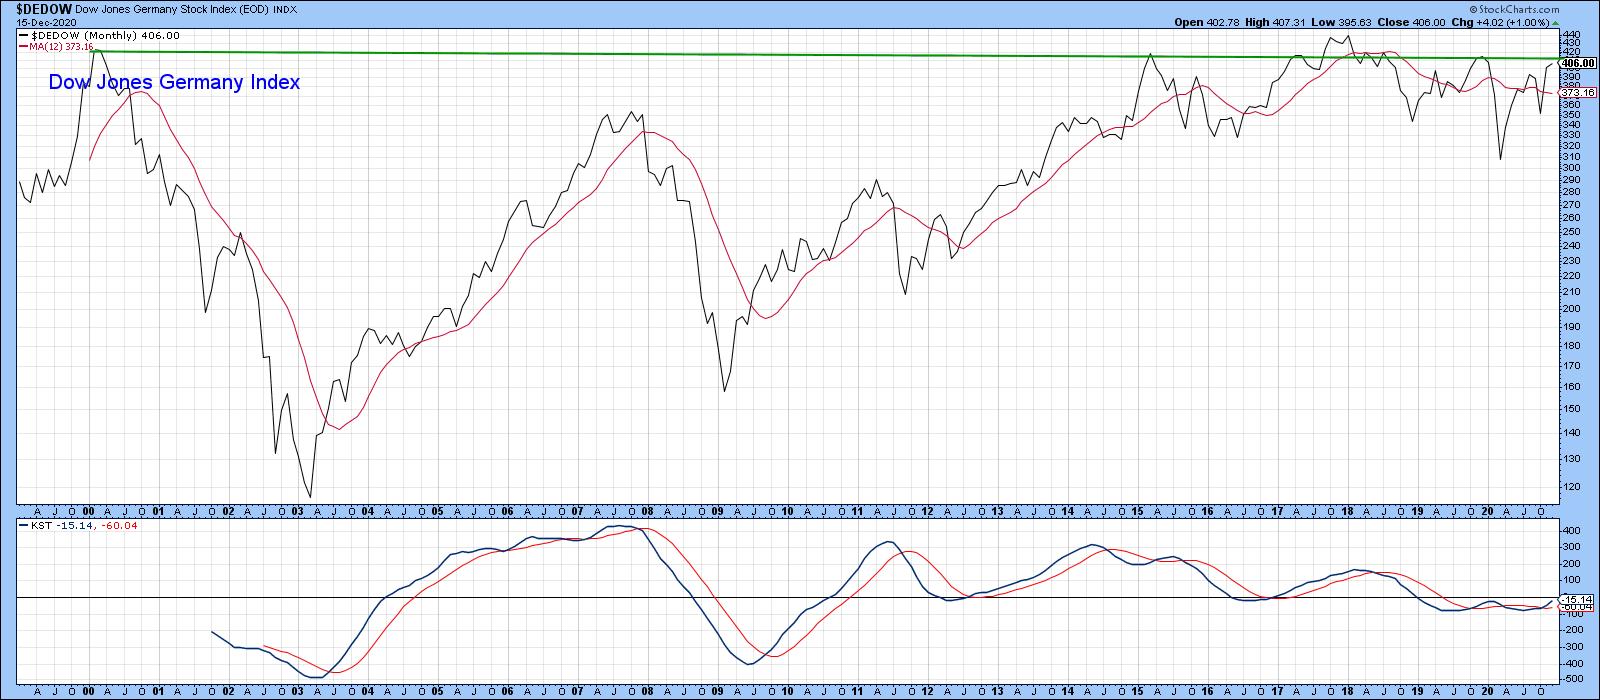 Chart 6
The Italian market has definitely lagged most of Europe in the last couple of decades. Now, however, it looks set to experience a breakout of its own - not necessarily to new all-time highs, but still with a good chance of achieving a multi-year advance of its own.
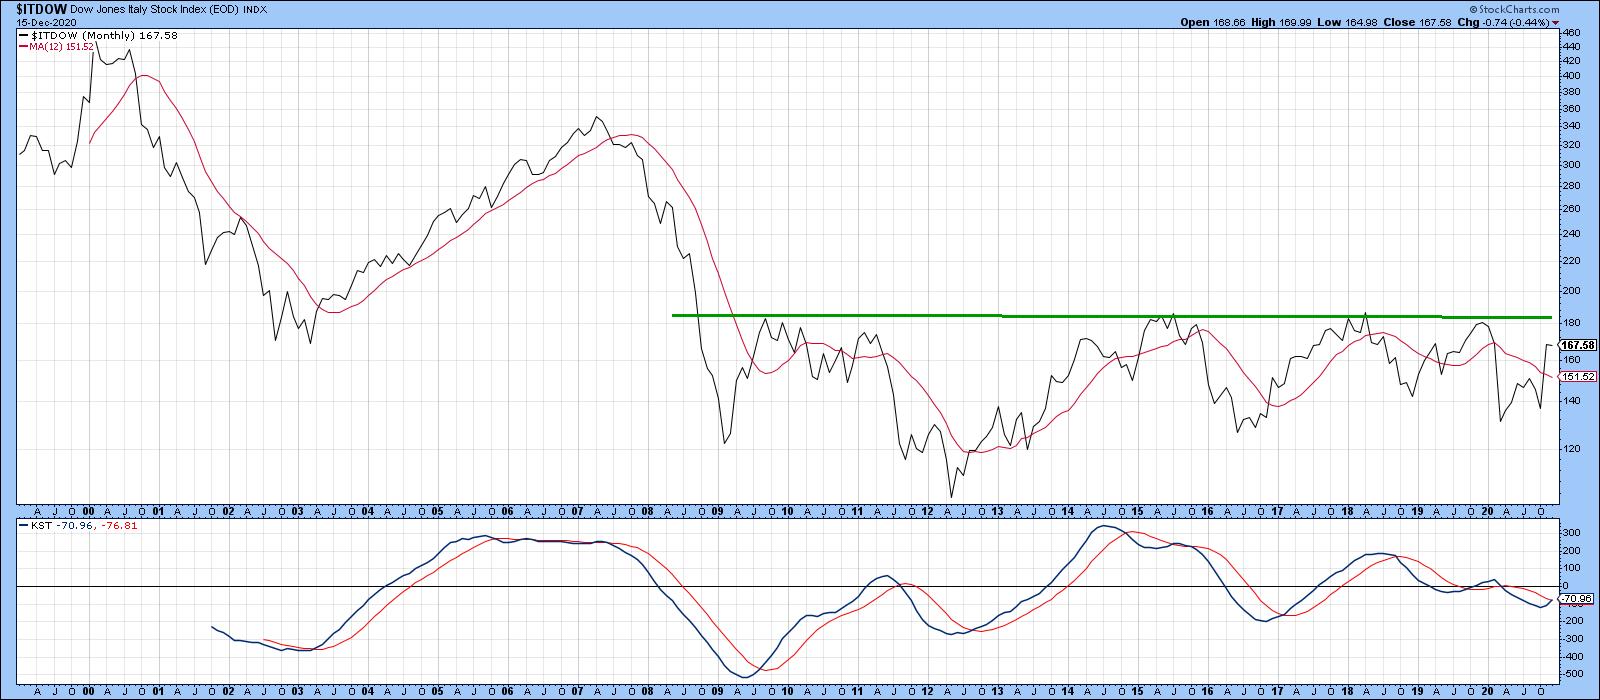 Chart 7
Asia
The Nikkei peaked way back in 1990 and since been confined to a giant trading range. Chart 8 shows that it has been zig-zagging its way higher since the 2008 low. That action represented the right-hand part of a 30-year trading range. November saw the Index literally explode out of this base, accompanied with a long-term KST buy signal.
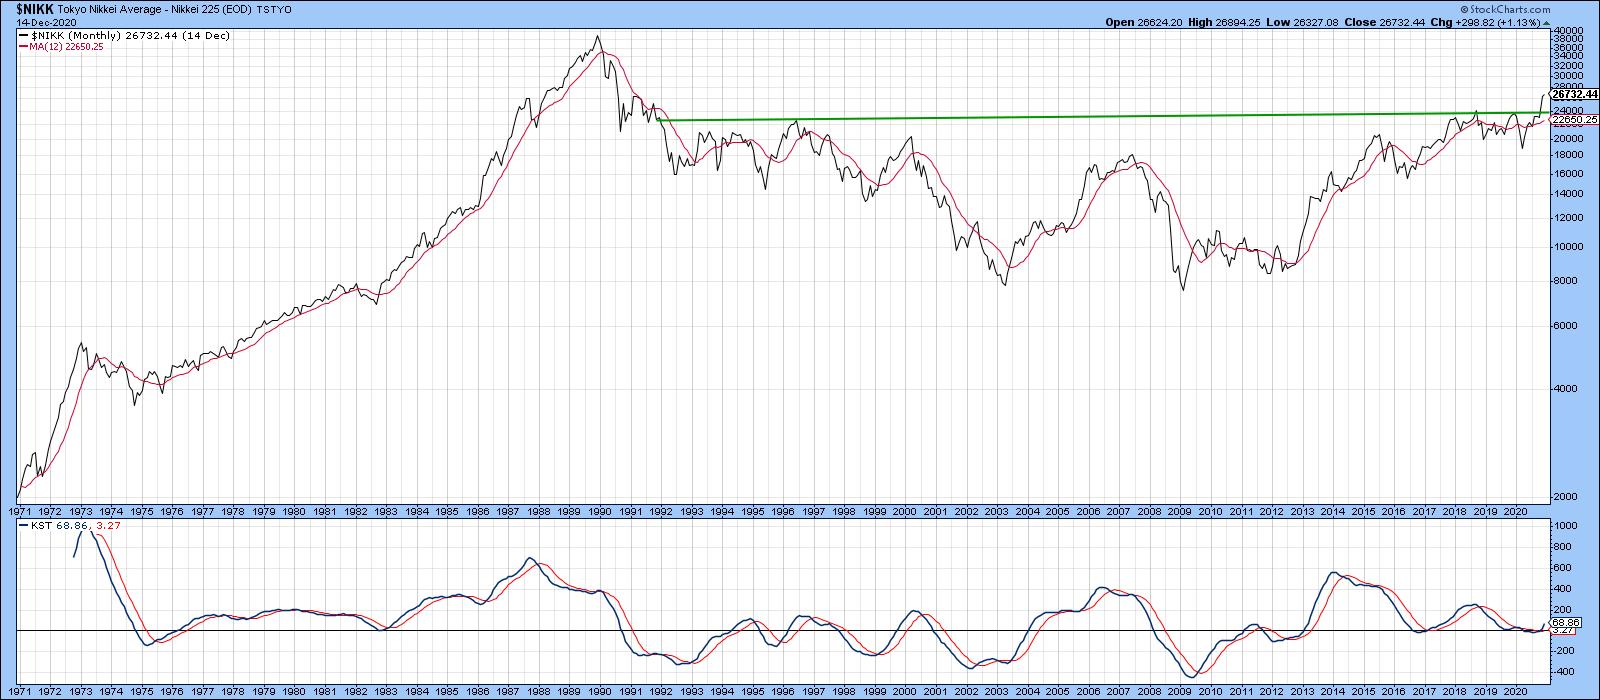 Chart 8
The Taiwan Weighted Index ($TWI) offers a great example of a former resistance level, in the form of the green trendline in Chart 9 reversing its role to support following the breakout. The index is clearly overextended near-term, but the size and depth of the 1996-2017 consolidation suggests that plenty of unrealized upside potential continues to exist.
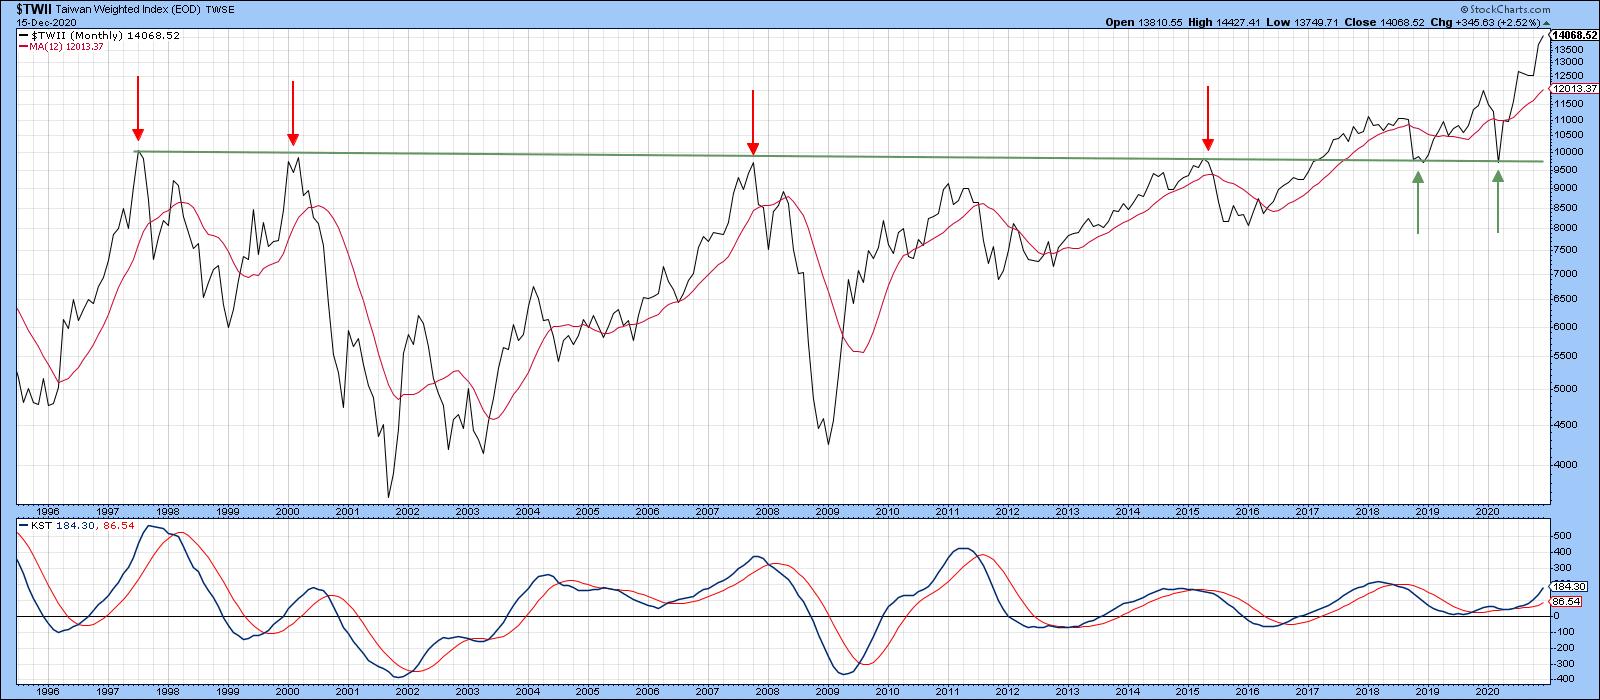 Chart 9
Emerging Markets
Chart 10 shows that the MSCI Emerging Market ETF is knocking on the door of a giant breakout of its own. Once again, a rising long-term KST strongly suggests that such a move will take place, thereby signaling the likelihood of a multi-year advance.
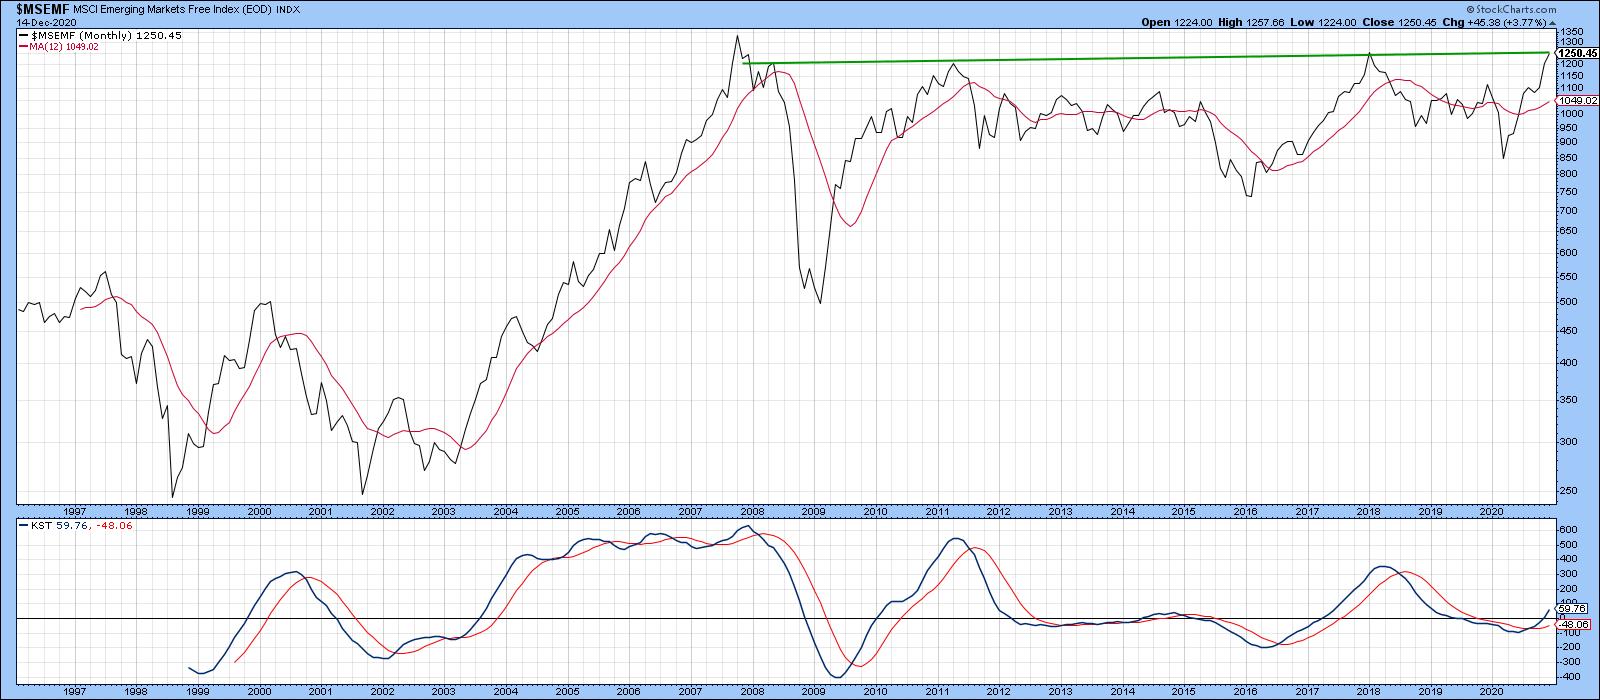 Chart 10
Back to the US
The US stock has not experienced a large trading range similar to some European and Asian markets. However, its price action relative to the 30-year bond has. That breakout developed in 2017. In early 2020, a normal retracement move took the ratio back to its extended breakout trendline. Now it has completed a right-angled broadening formation, as flagged by the dashed green trendlines. It has also experienced a long-term KST buy signal. Right-angled broadening formations are usually followed by above-average price moves. That's because they are, in reality, reverse head-and-shoulders patterns that are so positive they do not have enough time to form a right shoulder.
The breakout and KST buy signal only tells us that stocks are likely to outperform bonds, not that they will rally in their own right. However, the arrows plotted against the S&P tell us that KST buy signals for the ratio are typically followed by an extended advance in the Index itself. I have labeled the breakout "tentative" as this is a monthly chart; the latest plot can only take place officially at month's end.
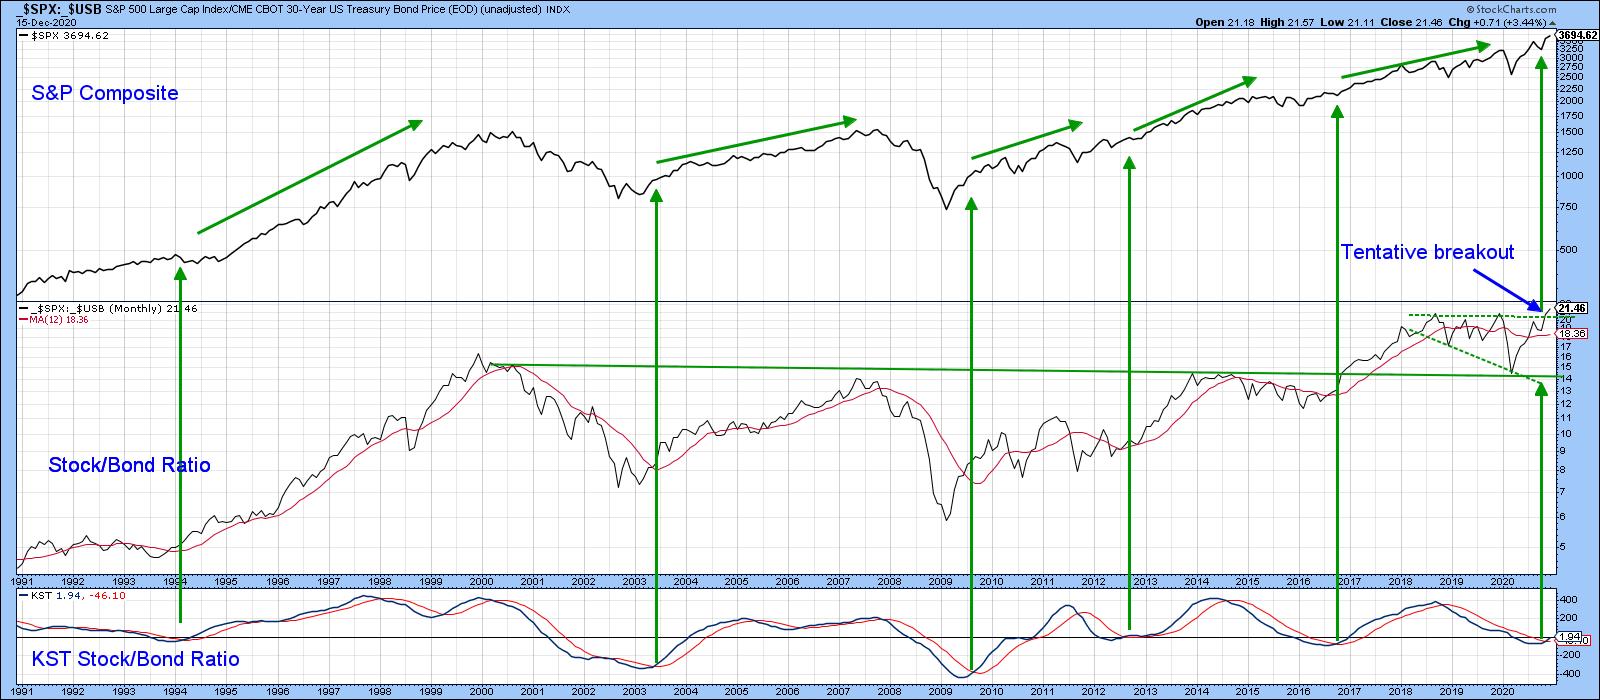 Chart 11
Currently, the market is very overextended on a short-term basis, so we should not be surprised if a near-term correction sets in. However, it seems to me that the positive long-term picture is so powerful that we are better served to focus on that, rather than a short-term correction that may or may not take place.
This article was originally published on Tuesday, December 15th at 6:19pm ET in the member-exclusive Martin Pring's Market Roundup blog.
Good luck and good charting,
Martin J. Pring
The views expressed in this article are those of the author and do not necessarily reflect the position or opinion of Pring Turner Capital Group of Walnut Creek or its affiliates.


