As much as people speak of gold's value as a safe haven, its performance in 2020 has done much to dispel that investment thesis. Recent months have seen gold and gold stocks underperforming the S&P 500. Is the pattern of new highs for stocks and new lows for gold near its end? Here are three tells that could indicate when gold stocks may be indicating upside potential.
As stocks sold off in late February, gold rallied to make a new high in early March. Soon after, the yellow metal plunged along with stocks, and both asset classes accelerated to their eventual bottom in late March.
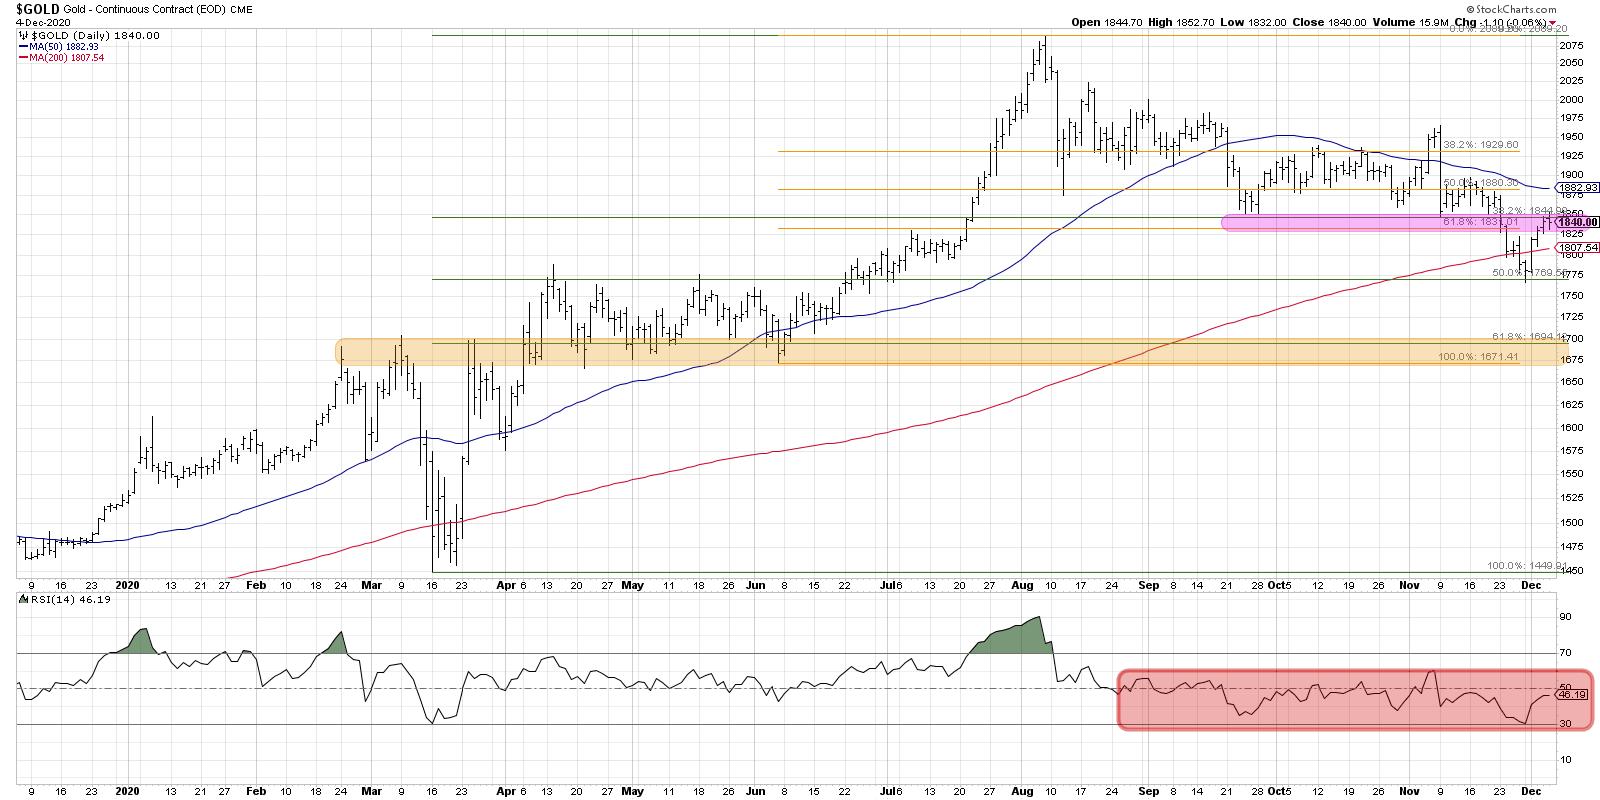
After a strong rally into a bearish engulfing pattern in early August, gold has entered a fairly consistent pattern of lower highs and lower lows. A selloff in late September pushed the price down to its first Fibonacci objective (green horizontal lines) using the March low and August high as the framework.
Gold then moved higher to test resistance a number of times at the 38.2% retracement level, using the June low and August high (orange lines). November saw a failed breakout above resistance and a retest and subsequent failure at the September lows.
Now, gold has broken down through its 200-day moving average for the first time since March. A bounce higher this week took the price back up to the 1825-1850 range (pink shaded area) and I would not be surprised if this previous support level now becomes resistance.
The RSI is notably in a confirmed bearish range (red-shaded area). This means that, when the price bounces higher during the downtrend, the RSI never gets much above the 60 level. Given the downtrend in price, the bearish RSI range, and the retest of resistance this week, it appears that a continued down move to the final Fibonacci support level around 1675-1700 is a reasonable downside objective.
Now let's look at gold stocks, in the form of the VanEck Vectors Gold Miners ETF, and see how that relates to our take on the gold spot index.
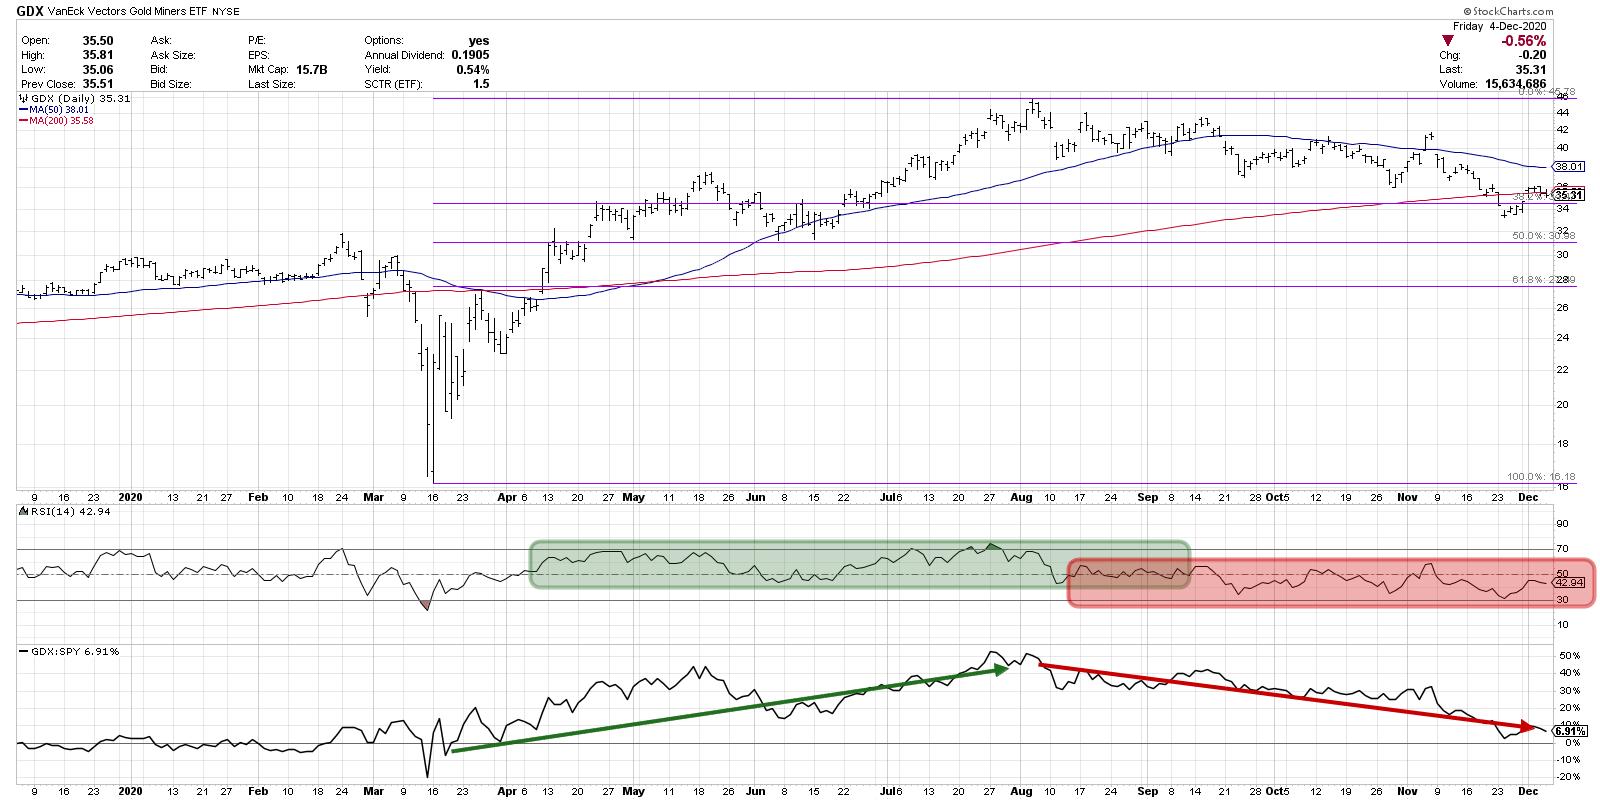
Similar to the gold price, the GDX is in a confirmed downtrend of lower highs and lower lows since the August price peak. It recently broke down through its 200-day moving average and is now retesting this smoothing mechanism from below. If gold does continue lower to around 1700, then a similar move would take the GDX down to its own Fibonacci support level around 28.
This brings us to our first tell: the GDX would need establish a higher low. Charles Dow wrote that a downtrend is comprised of lower highs and lower lows. Once we confirm a higher low, that could indicate an influx of buyers and increased potential for further upside.
Second, we can see that the RSI is in a bearish range (red-shaded area). Note how that looks different than the bullish range that we saw in April through September of this year.
Our next tell would be the RSI rotating to more of a bullish range. You would need to see upswings that take the RSI to 70 or higher, as well as an RSI no lower than 40 on any pullbacks. That would suggests increased buying power and imply that investors are "buying on the dips" and betting on further upside. In addition, we can see the rotation from a period of outperformance (green arrow) to underperformance (red arrow) as gold stocks have lagged behind the broader equity indexes for the last four months.
Our final tell is an upturn in the relative strength line. This would suggest that investors are rotating into gold stocks enough to drive the price higher relative to other names.
In many ways, the chart of the GDX provides a clear example of an ETF in a bearish phase, with price breaking down through support on weaker momentum and deteriorating relative strength.
An improvement in these three characteristics would suggest much higher potential for price appreciation going into 2021.
RR#6,
Dave
David Keller, CMT
Chief Market Strategist
StockCharts.com
Disclaimer: This blog is for educational purposes only and should not be construed as financial advice. The ideas and strategies should never be used without first assessing your own personal and financial situation, or without consulting a financial professional.
The author does not have a position in mentioned securities at the time of publication. Any opinions expressed herein are solely those of the author, and do not in any way represent the views or opinions of any other person or entity.


