This year created an extreme assortment of performance across financial advisors, hedge funds, individual investors, young entrepreneurs, self-directed investors and family office agencies. Those that protected capital might not have done as well if they didn't get back in early. Those that rode the whole thing out look like heroes, as civic, state and federal governments threw money at the pandemic response hand over fist... WORLDWIDE! The amount of debt incurred at a government level was phenomenal, and those same government officials recognize that the current politicians will never be around to have to suffer through the payment cycle. Here we sit at the back side of the single biggest liquidity flood in world history. Not only was it big, it was epic.
The next four charts roll through the four quarters of the year, remembering that the bottom was not at the end of one of the quarters. They are in sequence, Q1, Q2, Q3 and Q4.
People who patted themselves on the back for staying invested through it all are more than lucky it never rolled over again, as the other people who used historical models of defense tried to protect capital. If the vaccines had turned out with bad efficacy levels, it would have been a dramatically different fourth quarter. The good news is it worked out. At the end of March it was a train wreck, and the best performing parts of the market were defensives. Growth gurus looked like ice on a desert floor. They were quickly succumbing to the pressure.
This was Q1.
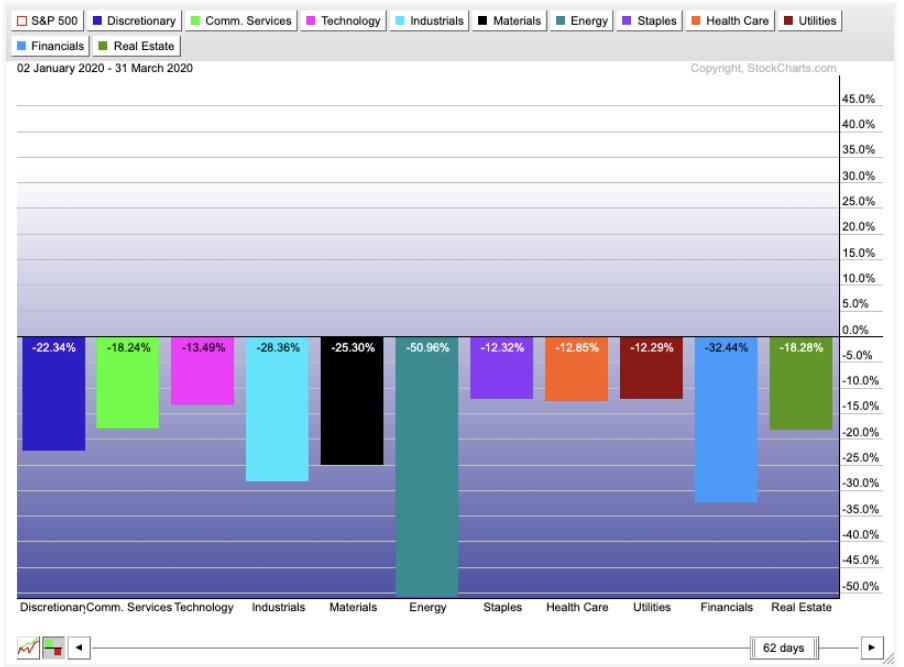
Moves to Staples and Utilities or a move to cash to preserve their life savings actually didn't work out that bad. They had the best results at the end of the 1st quarter (but still big losses) and the former tech investors using bullish options were smoked. Many wiped out their accounts. Some were literally remortgaging homes that were paid off, selling assets for margin calls and dealing with layoffs. The destruction was rapid.
But it was the ability to flex with the government response globally that ultimately worked out. If you had some capital preserved, the start of Q2 was a wonderful place to get long. I had one chart that I wrote - governments invest 6.6 trillion - get long!
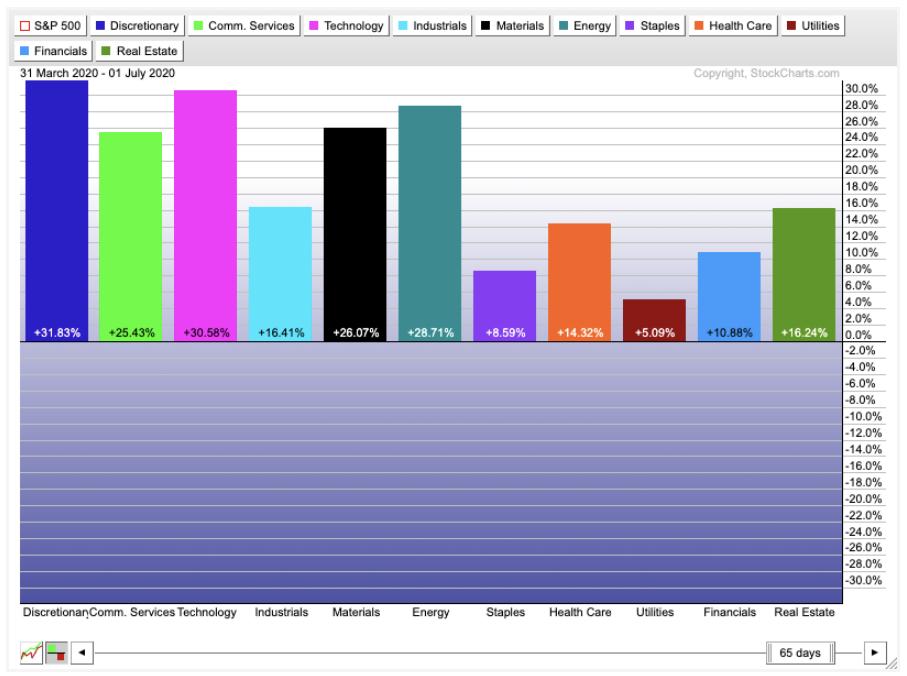
Right now, many investors are doing look backs. The charts I roll my eyes at the most are the 10-year historical performance charts - conveniently after the 2009 debacle - of the different sectors, like that would be the ultimate guide to navigating the financial path while shutting down the world. What worked historically in these times, the defensives, were not the goto sectors after the flood, groundswell, air drop, deluge, tidal wave of government money. It was the software industry with stretched multiples, inviting you to go on a remarkable ride in the face of a rising death toll worldwide. The difference between a 2020 pandemic and a 1995 pandemic was that of the global connection of the internet, which changed how the world had to respond.
Office jobs worked from home, but still worked. Within my family, the COVID crisis actually meant we got to spend more time with our daughters that had moved away. Remote work (moving back to the roost while still working) proved not only possible, but proved to be the strategy for continuing to try and keep as much business moving forward as possible.
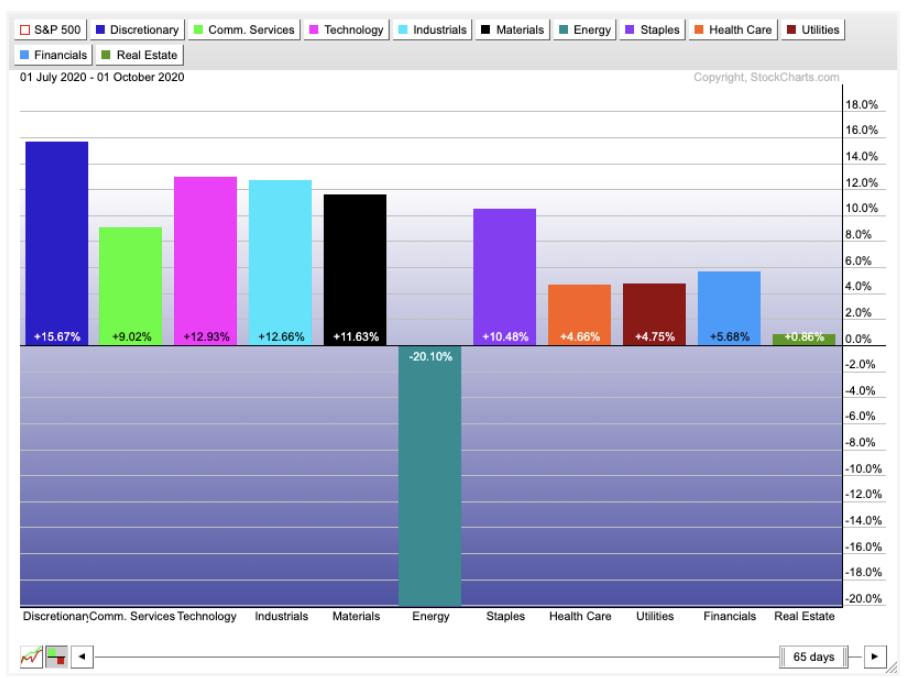
In the third quarter, it was more of the same, knowing that another global shutdown was probably going to occur. While the world had lots of oil and improving demand, it was not enough to rescue the second wave for the energy sector. Energy plummeted, and stay-at-home trades swelled. Defensives were up marginally, but were vast underperformers compared to discretionary and technology. Yes, it will be the year to analyze buying consumer discretionary in a pandemic. It worked and now the path seems clear, but that was not obvious in the face of rising death tolls.
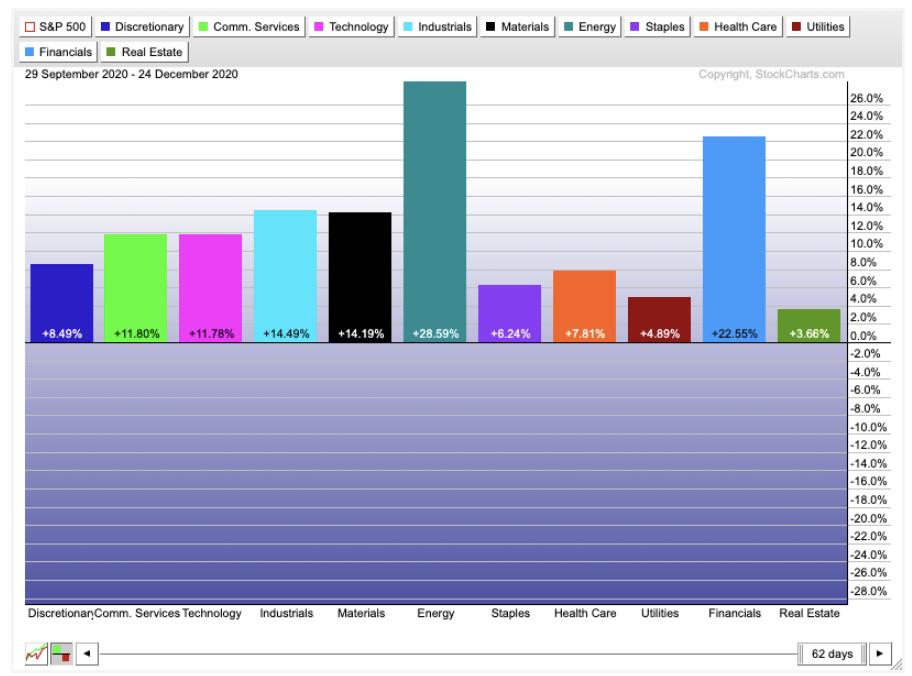
The fourth quarter, with a few days left to run at the time of this article, changed remarkably again. What was the worst, became the best. Technology stalled with September highs, and, on the strong results from the COVID efficacy data, the cyclical areas of finance and energy all rose from the ashes. While these were big performers, it was only when the vaccine data came out that these really recovered.
For those that have to manage money professionally, it was extremely difficult to be as flexible as the wild gyrations of the 2020 market. Every quarter was different. For individual investors, it was about managing the preservation of capital while trying not to miss the move. If you have nothing left in retirement, it hardly makes sense to put it into the wildest, most expensive stocks one quarter, then the most beaten-down names the next.
Through it all, there are still pessimists that missed the entire ride. The pessimists are well represented by the group I still see on my twitter feed, who can't see sunshine on a blue sky sunny day. While they are right that all the metrics of a normal world are a mess, they can't see higher highs as bullish and keep forecasting the ultimate drop. When the world is breaking out to higher highs, you are not in a bear market. Bear markets don't have higher highs. While they were right in the Q2, Q3 and Q4 crushed their knowledge of historical patterns.
It is a pretty important year to be humble. It was a year where people lost fortunes and made fortunes. A year where some sold at the February highs and never got back in, or sold at the lows and never got back in. There were those that rode through the fastest 35% market crash in world history and wiped out their account using strategies that had worked for years. Those that saw the primary world source of energy trade negative overnight for the first time in history lived through what was an amazing year. Commodity investors blew up all around the world as historical statistics were wiped out. It was an important year to remember that, at any time, almost every investor had the mental fatigue of a terribly performing account within the year.
So, to be humble, I won't say how I did. For those touting their success to the 0.1%, congratulations. Much like in politics, this would be the year to help each other forward. Every politician failed miserably, but also had some successes. The high-efficacy vaccines to wrap up the year have given politicians and investors immense confidence for the next year.
I could list a string of things I thought the politicians did badly. I could list some of the errors I made. As an example, I was hedging oil against a rollover to the downside after the initial energy rally in the second quarter, and was wrong. I closed the hedge, and the third quarter was abysmal, with oil dropping, and my hedge would have been perfect. After licking my second quarter wounds in the trade, I was not about to put it back on. Then I was long for the big run in the fourth quarter. The result was excellent, but mentally demanding. It was that type of year.
One of the situations I am most concerned about is the blind focus by current governments that the governments of future years can deal with this outlandish debt. At this time, it appears to be the right thing to do. As an investor, that is not our job to question the world strategy. It is to figure out when to be bold and when to be more cautious. For those that never got cautious this year, I would suggest their "home alone" moment will show up at a later date. For those that never got bullish again, scars are hard to heal.
Lighten up on yourself, as it was a year where almost every investor questioned their work. Which part of the year beat you up is a good question, but very few escaped unscathed. All of us will remember 2020. You have been through record downside moves, upside moves, commodities trading below zero, the fastest vaccine discovery ever, the largest death count and the largest government spend EVER! Best wishes for 2021!
Good trading,
Greg Schnell, CMT, MFTA
Senior Technical Analyst, StockCharts.com
Author, Stock Charts For Dummies
Want to stay on top of the market's latest intermarket signals?
– Follow @SchnellInvestor on Twitter
– Connect with Greg on LinkedIn
– Subscribe to The Canadian Technician
– Email at info@gregschnell.com
