
My first article for the Chartwatchers newsletter going into the new year... 2021!!
First of all, I wish all readers and watchers of Sector Spotlight a very happy and, above all, healthy new year. That "Healthy" part all of a sudden has gotten a whole new meaning after 2020, in the sense that it is more serious than ever before.
Let's kick off 2021 with a look at the Relative Rotation Graph for US sectors and the Financials sector in particular.
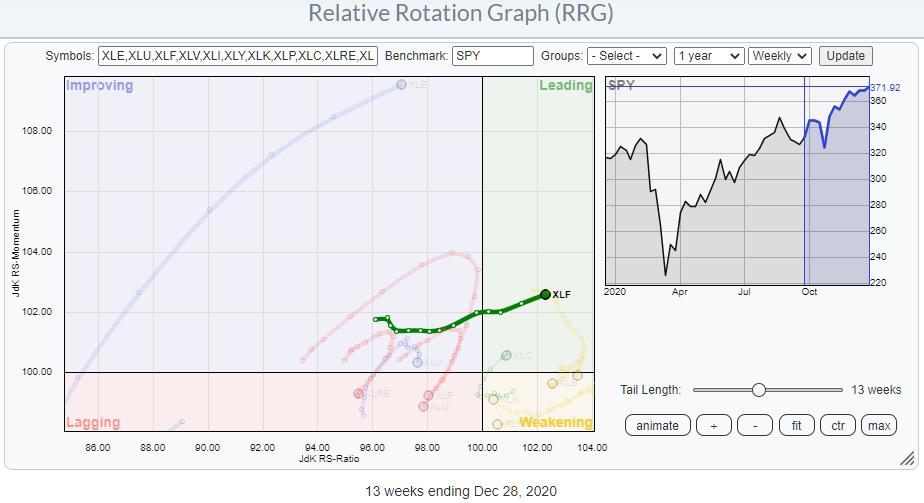
The tail on XLF shows a stable move towards the right, more positive, side of the RRG. And, together with XLC (Communications Services), it is one of the only two sectors inside the leading quadrant; both are rotating at a strong RRG-Heading.
The RS-Momentum level has been fairly stable over the last 13 weeks, causing an almost straight tail. The pickup in relative momentum, in combination with the increasing RRG-Velocity (distance between the weekly observations), makes Financials a very interesting sector to keep an eye on while going into the new year.
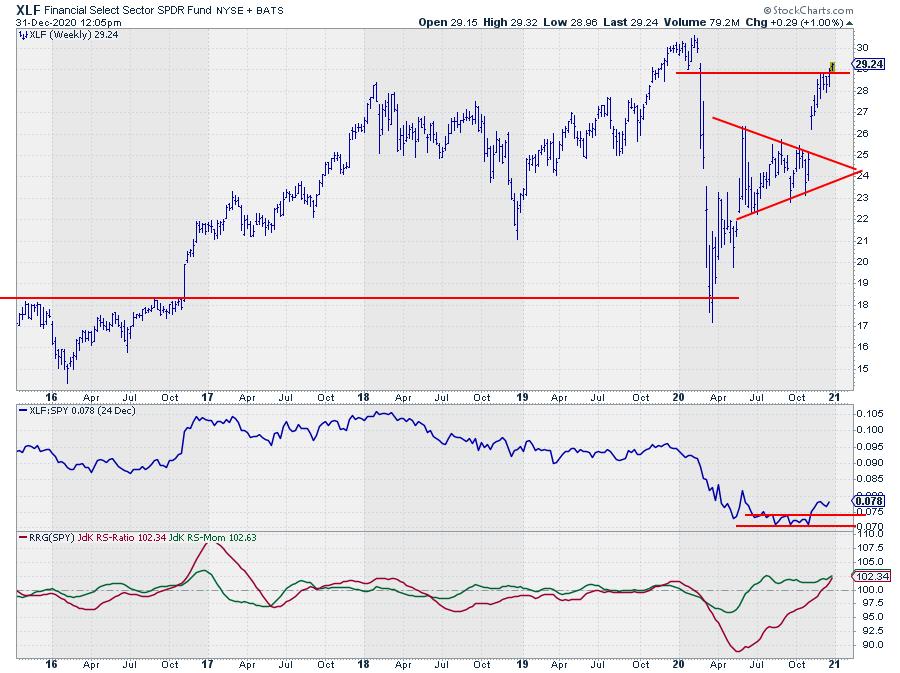
After breaking away from the consolidation triangle that was formed from May to October, XLF stalled against resistance just below $29. This week, XLF looks to be taking out that resistance level, which frees the way towards the February high at $30.60.
What is more important is that the relative strength line managed to hold up above its breakout level and seems to be putting in a new, higher, low, confirming that the early stages of a new relative uptrend are taking shape.
Zooming in on Individual Stocks
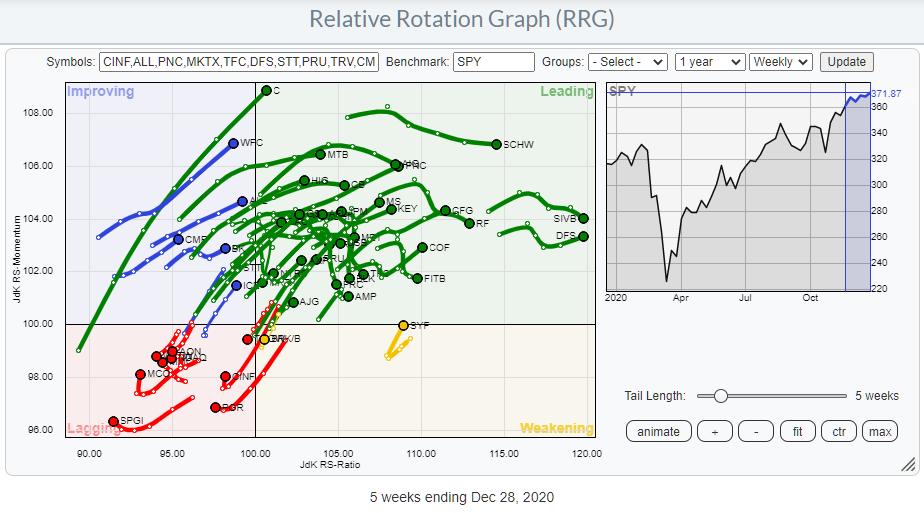
The RRG above shows the individual stocks inside the financials sector against SPY as the benchmark. The clear shift, with the majority of Financial stocks inside the leading quadrant, confirms the underlying strength for the sector.
Takeaway... The stocks that are inside the lagging quadrant against SPY are CERTAINLY inside the lagging quadrant against XLF and are the weakest in the sector!
You can also see that a few stocks have already travelled to (very) high JdK RS-Ratio levels. These are the strong(est) stocks for the moment. But the odds for them to travel even further are getting lower. Or, in other words, the risk/reward ratio is getting higher and potentially less interesting.
So, for possible new candidates that could emerge as new leaders for the sector going into the new year, I run the RRG for these Financial stocks against XLF.
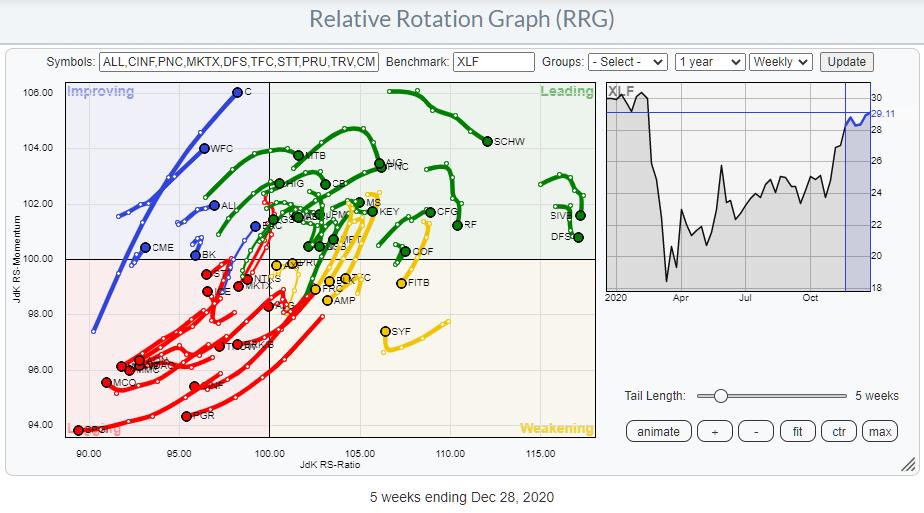
Here you see a more evenly spread out universe around the benchmark, which is to be expected as this is a so called "closed-universe" where all members of the benchmark are plotted on the chart.
As we already know that XLF is at a strong rotational heading and inside the leading quadrant, I want to focus on stocks that are either inside the improving quadrant and traveling towards leading at a strong heading or stocks inside the weakening quadrant that are curling up and started rotating back up to the leading quadrant.
The next RRG below, shows the most (imho) interesting stocks that seem to be setting up to become new leaders inside the financial sector.
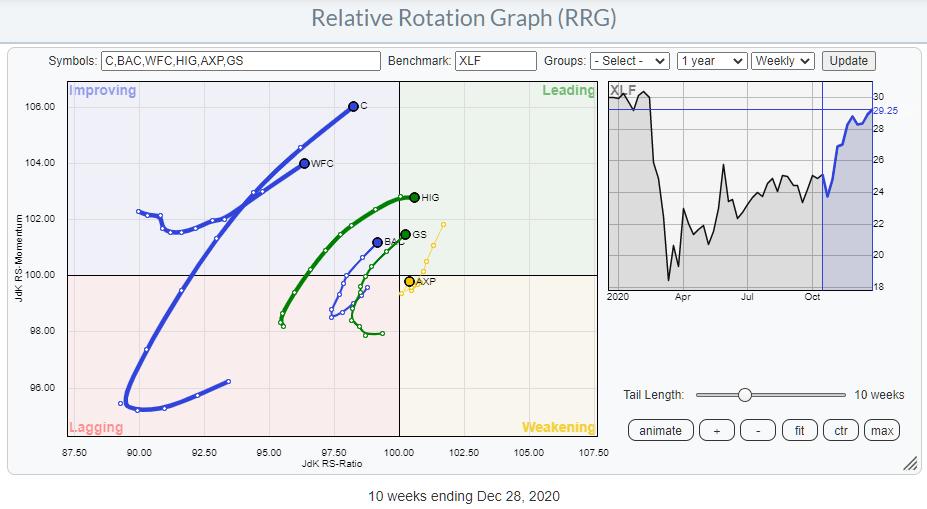
I have isolated 6 names on the chart above and what I found interesting to see is that the three stocks inside the improving quadrant are all banks, which makes that group even more interesting to watch in the next few weeks.
After studying all three of these banks inside the improving quadrant (C, WFC, BAC), I think BAC is showing the most promising chart.
Bank of America - BAC
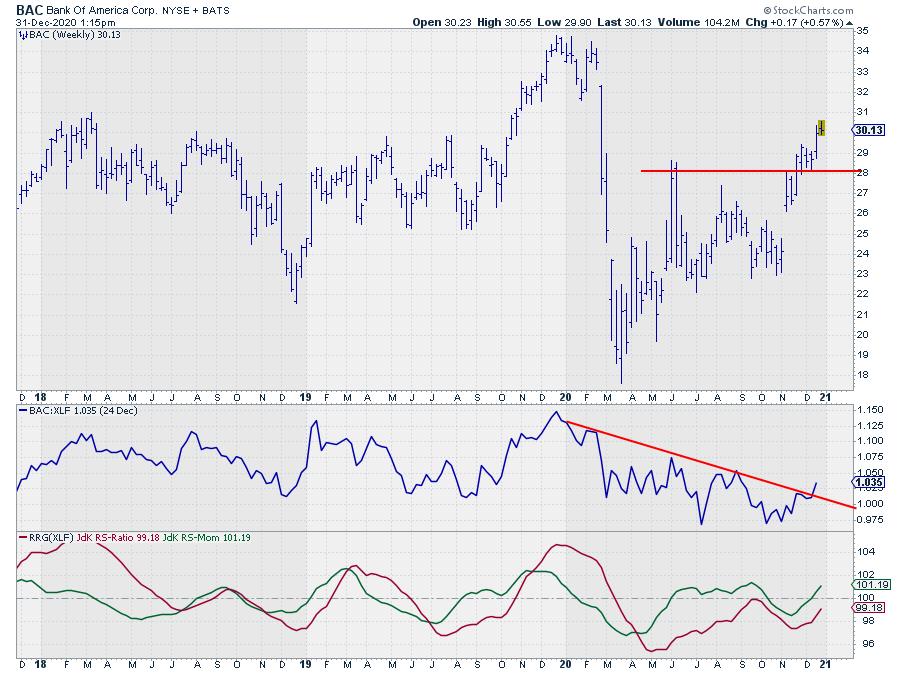
BAC already broke above resistance around $28 a few weeks ago, then hesitated a few weeks while managing to hold up above the breakout level. It is now starting to move away upwardly.
This makes it a pretty reliable breakout with solid support around $28, while the previous high just below $35 can be seen as the next target, with some intermediate resistance around $32 on the way up.
The turnaround in relative strength makes BAC a potential candidate to become a new leader in this sector. In general, 2020 was characterized as a relative downtrend for BAC against XLF - at least in the first six months. After bottoming in July, the RS-line held up above that low in its subsequent down-leg, which bottomed in the same area.
The move higher off of that support area is now breaking the falling resistance line, which is a first sign for improvement.
Combined with the improvement and the break in the price chart, this sets up BAC for a good start in the new year!!

Here's a toast to a Happy, and much better, New Year. Hope to see you all back as readers of the RRG blog and watchers of Sector Spotlight. As usual, please stay in touch!!
My regular blog is the RRG Charts blog. If you would like to receive a notification when a new article is published there, simply "Subscribe" with your email address.
Julius de Kempenaer
Senior Technical Analyst, StockCharts.com
Creator, Relative Rotation Graphs
Founder, RRG Research
Host of: Sector Spotlight
Please find my handles for social media channels under the Bio below.
Feedback, comments or questions are welcome at Juliusdk@stockcharts.com. I cannot promise to respond to each and every message, but I will certainly read them and, where reasonably possible, use the feedback and comments or answer questions.
To discuss RRG with me on S.C.A.N., tag me using the handle Julius_RRG.
RRG, Relative Rotation Graphs, JdK RS-Ratio, and JdK RS-Momentum are registered trademarks of RRG Research.
