Happy New Year!
Many market pundits view every year in the stock market exactly the same. I do not. I believe there are "big picture" headwinds and tailwinds that impact the stock market in much the same way as currents impact fish attempting to swim upstream vs. downstream. Or maybe consider the effect that the jet stream has on a plane traveling east to west vs. west to east. A fish swims faster downstream. A plane travels faster west to east (in the U.S.).
The stock market performs stronger in a secular bull market given the exact same fundamentals. It's just the way it works.
As we move into a brand new year, I want you to think about 5 things as they relate to this secular bull market that we're enjoying:
Bird's Eye View
Sometimes, when you're in the midst of something, you don't truly understand the significance of it. But when you step back and look later, it all becomes much clearer. Well, I believe we're in the midst of one of the best secular bull markets of our lifetime. When you deal day-after-day with a trade war, and then a 100-year pandemic, it's very easy to become easily distracted and lose sight of the big picture. I want you to re-focus on the big picture:
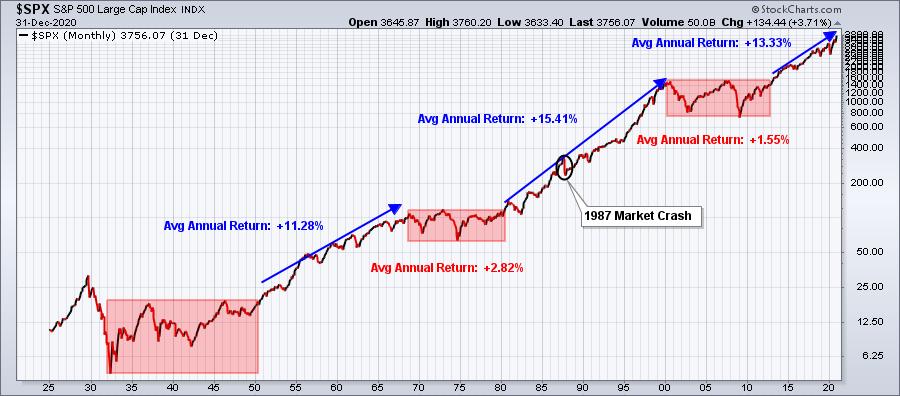
History repeats itself, and we're currently in the midst of another strong secular bull market advance. We swept the trade war and pandemic to the side just like the 1980s-1990s secular bull market scoffed at the 1987 market crash. Based on the above chart, I believe the current secular bull market will continue throughout this decade, at a minimum. You can fight it or join it.
The Biggest Advances Occur in the Month of Earnings
I've broken down the last decade's rally into 3 "baskets", if you will. First, there's the month of earnings or "Month 1" (January, April, July, and October). Then there's "Month 2" (February, May, August, and November). Finally, there's "Month 3" (March, June, September, and December). Want to see a breakdown of how the S&P 500 has performed among these 3 months?
- "Month 1": +7.4%
- "Month 2": +3.8%
- "Month 3": +0.5%
After seeing the above numbers, I hope you're a believer that Wall Street accumulates stocks as earnings season approaches. If not, you might consider the following annualized returns for the S&P 500 throughout the past decade:
- December 28th - January 18th: +35.16%
- March 28th - April 18th: +35.43%
- June 28th - July 18th: +63.71%
- September 28th - October 18th: +19.15%
Do you believe me now?
Aggressive Sectors Lead
Anyone who follows my work knows I despise diversification. That's the media "teaching" us how to invest, which is laughable. When you're in a secular bull market, there's one thing holding back your performance. It's diversification.
Warren Buffett, arguably the best investor of all-time, summed it up best when he said, "diversification is a protection against ignorance." He went on to say, "it makes very little sense for those who know what they're doing." During secular bull markets, invest primarily in aggressive sectors and maximize your returns and financial security. On April 10, 2013, the S&P 500 finally cleared the prior highs set in 2000 and 2007. That's really what triggered the current secular bull market. Let me summarize for you the cumulative returns of our 11 sectors from that date through December 31, 2020, compared to the "widely diversified" benchmark S&P 500:
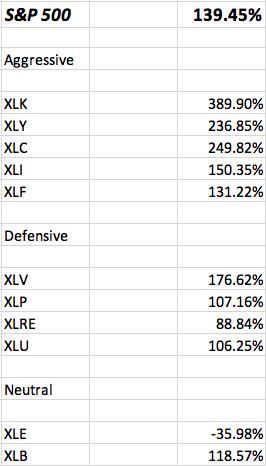
How might you have done if the majority of your investments had been in those 5 aggressive sectors? If you want the one real key to how we significantly outperform the S&P 500 with our portfolios at EarningsBeats.com, the above breakdown is it. We invest in what's working and ignore what's not. Why throw your money down a rat hole?
Weighting your investments appropriately is extremely important during these bull markets. We have both stock and ETF portfolios at EarningsBeats, with nearly every one significantly outperforming the benchmark S&P 500. Some might look at our numbers and think it's impossible. It's not. Unfortunately, we're "trained" by the media to buy into the diversification theory, which only hinders our returns. Change the way you think. Invest in what's working and based on where we are in the stock market cycle. During a secular bull market, concentrate your investments or trades in the aggressive sectors. Leave the underperformance to those wanting to benefit from "diversification."
Stay the Course
We've all heard it before. "We can't go any higher." Or "but we've gone up so much already." Or maybe it's "What about our pile of national debt?" or "the house of cards will come tumbling down next year!"
Consider these facts:
- The S&P 500 has risen 52 of 71 (73.2%) years since the start of 1950
- The S&P 500 has risen 38 of 48 (79.2%) "secular bull market" years since the start of 1950
- The S&P 500 has risen 14 of 23 (60.9%) "secular bear market" years since the start of 1950
While there are absolutely times that we want to be more cautious, I will never understand the determination of the many market participants on the "dark side," who consistently bet against U.S. stocks. Those numbers do not lie. They are factual and should convince you to remain primarily bullish.
Technicals Rule
In March, we kept hearing about the coming Great Depression 2.0. It makes for scary headlines and is excellent click bait, but the charts never suggested such a calamity was about to unfold. It's always scary to see your portfolio plunging, but it's also very important to look objectively at what's occurring. Don't listen to those who do not have your personal financial interest in mind. This includes the hype-driven media outlets, who only care about you clicking on their articles, driving up clicks and revenues.
I wrote an article back on April 10th in ChartWatchers that you should go back and read. I'm not writing this article telling you anything in hindsight. My articles are archived here and the one I wrote on April 10th was in real-time, in the midst of this once-in-a-lifetime pandemic. The article was titled, "This is How I Created My All-Star Trading ChartList". It marked the beginning of switching to the Accumulation/Distribution (AD) line as a primary technical indicator. Markets change and we MUST change with them. What worked last week, or last month or last year (or even last bull or bear market) likely won't work again. We must stay on our toes and continue to analyze. We need to look "beneath the surface" of the market to assess what's truly transpiring. This period and analysis led to our Strong AD Portfolio, which was initiated on May 19th and has gained 74.48% in the last 6 1/2 months, comparing quite favorably to the S&P 500's return of 28.50% over the same period.
I will continue to work tirelessly for our StockCharts.com and EarningsBeats.com communities. On Monday, I plan to provide our EB Digest (free newsletter) community a heatmap showing the groups that have been benefiting the most from January seasonality trends throughout the current secular bull market. If you'd like to receive this information, simply CLICK HERE to register. Registration does not require a credit card and you may unsubscribe at any time.
Let's hope that 2021 brings everyone hope, better health and more financial freedom!
Tom
