Carl Swenlin ingeniously created the newest DecisionPoint indicators, called the "Golden Cross Index" and "Silver Cross Index". It is actually a simple concept, and one he and I were both surprised hadn't been created yet.
Most are familiar with a "golden cross," the positive crossover of the 50-/200-MAs. The "Golden Cross Index" measures the percentage of components in an index that currently have the 50-EMA above their 200-EMA. Carl also came up with the "Silver Cross Index". Meanwhile, a "silver cross" is a positive 20-/50-EMA crossover, so the "Silver Cross Index" measures the percentage of components in an index that currently have their 20-EMAs above their 50-EMAs.
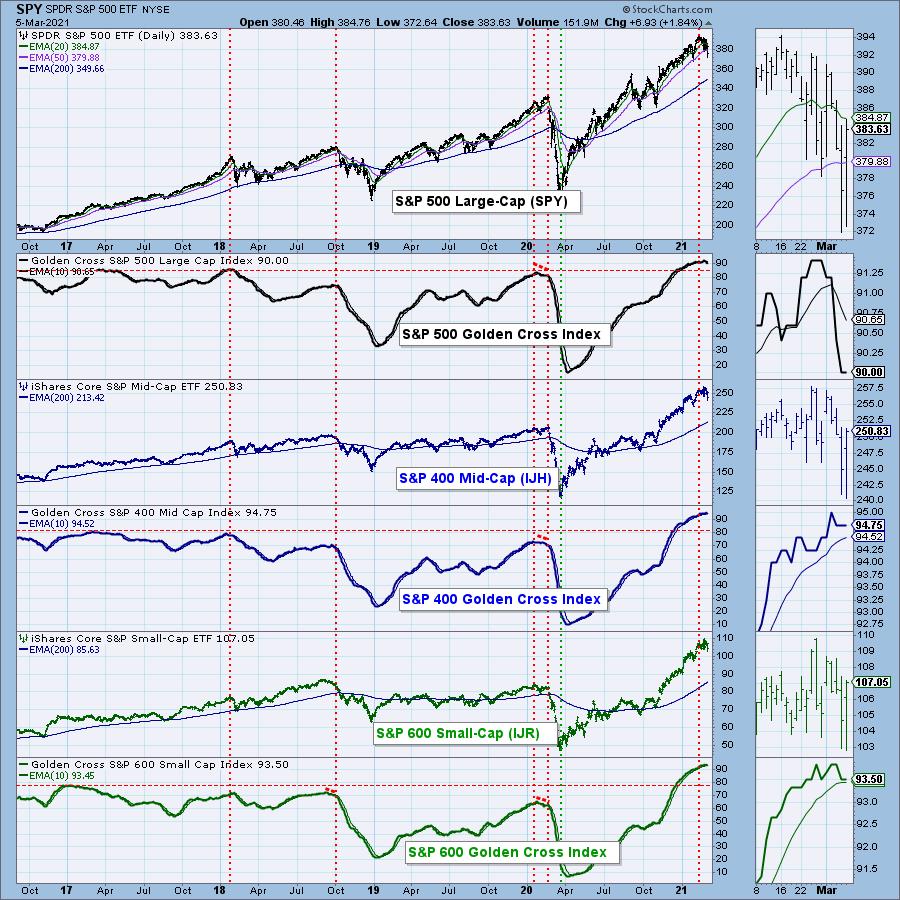
The Golden Cross Index (GCI) has been sitting at its "all-time high" (based on our data that goes back to 2017). This week, it dropped a full percentage point plus some. Last week we had a reading of 91.4%. Now, we have a reading of 90%. It moves slowly, so this decline was significant in my estimation.
Below, I have the Golden Cross Index chart for the major indexes. Notice all of them are extremely overbought. The S&P 400 currently has the healthiest GCI at 94.75%, but the S&P 600 is still above its signal line with a reading of 93.5%. It appears the longer-term foundation of the SPX is beginning to show small cracks. Note that cardinal tops (marked with the red vertical lines) typically arrive when the GCI tops.
IN JUST 10 MINUTES, EVERYTHING YOU NEED TO KNOW!
The DP Alert is the perfect primer to end every market day. In 10 minutes or less, you can read the daily DP Alert and know where the market is headed in the short- and intermediate-terms. You also get a review of Dollar, Gold, Gold Miners, Crude Oil and Bonds DAILY! We review the same charts to give you context and continuity, with interesting additions to complement the analysis for the day. Each report is easy to read and understand regardless of your level of experience.
SUBSCRIBE TO OUR BUNDLE TODAY and get one free week using this coupon code: DPTRIALCW. That is a $20 value for free!

Free DecisionPoint Trading Room on Mondays, Noon ET
Recordings Sent to All Registrants!

*Click here to register for this recurring free DecisionPoint Trading Room on Mondays at Noon ET!*
ALL REGISTRANTS RECEIVE A COPY OF THE RECORDING AT THE END OF THE DAY
The deterioration on the "Silver Cross Index" has been in force since the negative crossover of its signal line in January. The small- and mid-caps also experienced negative crossovers. None of these indicators are remotely oversold and suggest weakness ahead in the intermediate term.
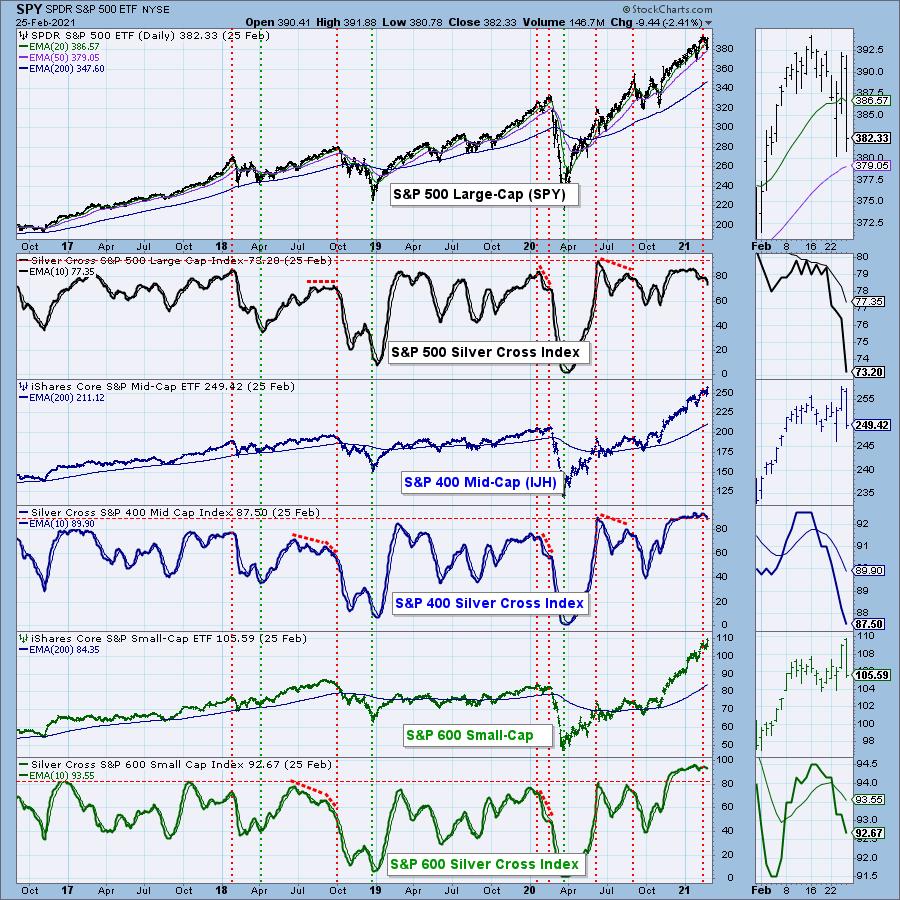
Conclusion: The Golden Cross Index had a negative crossover its signal line this week, while the Silver Cross Index was already declining after an earlier negative crossover. These negative crossovers generally come at intermediate-/long-term tops. While we likely saw a buying initiation today in the short term, look at it as an opportunity to sell into strength or move into more defensive areas of the market, like Utilities (XLU) and Consumer Staples (XLP).
Happy Charting! - Erin
Technical Analysis is a windsock, not a crystal ball.
Helpful DecisionPoint Links:
DecisionPoint Alert Chart List
DecisionPoint Golden Cross/Silver Cross Index Chart List
DecisionPoint Sector Chart List
Price Momentum Oscillator (PMO)
Swenlin Trading Oscillators (STO-B and STO-V)
DecisionPoint is not a registered investment advisor. Investment and trading decisions are solely your responsibility. DecisionPoint newsletters, blogs or website materials should NOT be interpreted as a recommendation or solicitation to buy or sell any security or to take any specific action.


