Over the last six weeks, we've seen a dramatic reversal from a rising rate environment to a falling rate environment. While this rotation makes perfect sense from a technical perspective, the fact that the ten-year yield has come down in the face of strong economic data this week is a bit of a head-scratcher.
How would falling rates impact equities and other asset classes, and why is the chart of the ten-year yield the most important chart in the market right now?
First, let's get a good historical perspective. The ultra long-term view of interest rates, courtesy of our Historical Chart Gallery, shows the multi-decade bull market in bonds.
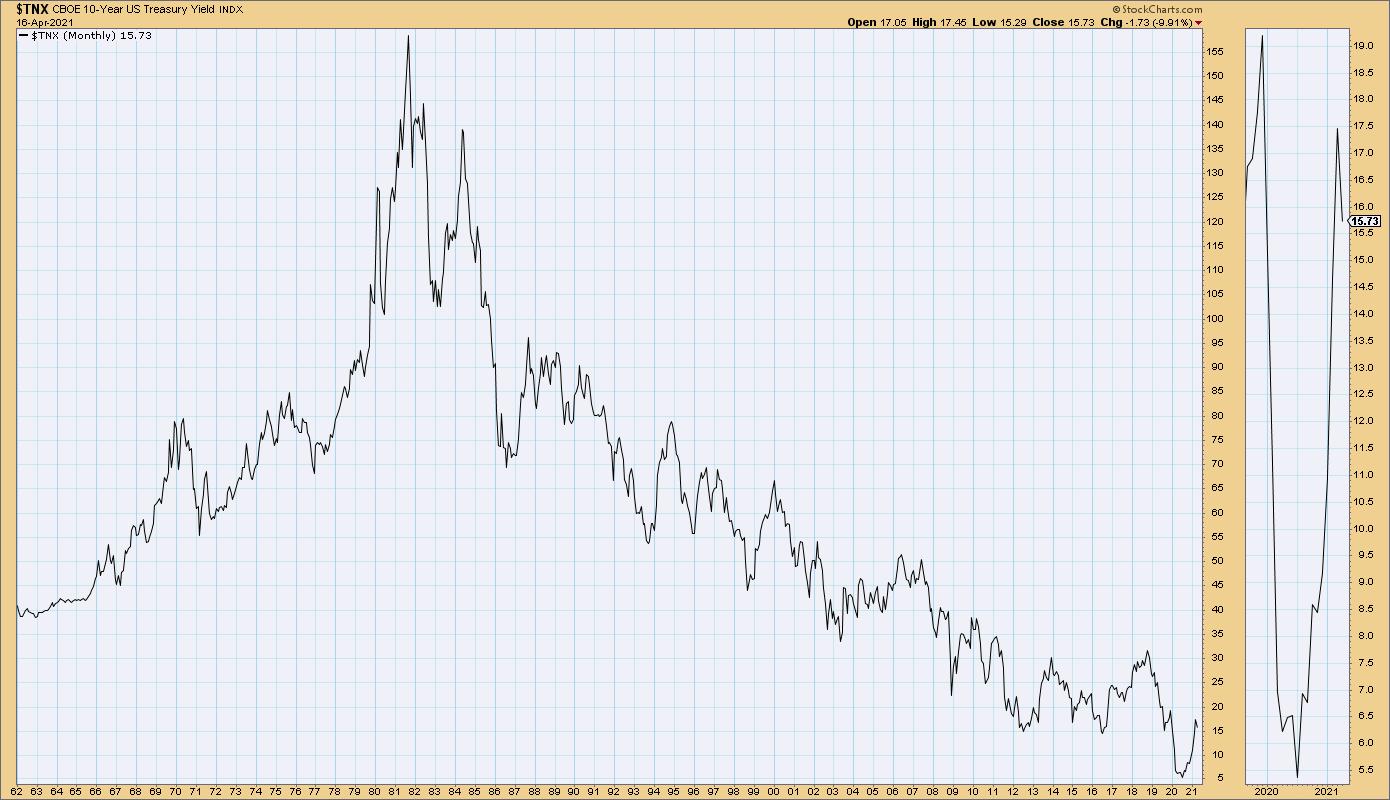
From 1980 through recent years, bond prices have been in a fairly consistent uptrend, which has driven this chart of the ten-year yield lower and lower.
All the recent discussion of interest rates rising? That's the little tiny blip in the far-right side of the chart. The question for many investors is, when will we see rates bottom out and move higher in a significant way?
Zooming into the last two years, you can see that, in the short-term, rates have reversed from a downtrend to an uptrend. While the ten-year yield bottomed in early March 2020, rates didn't really move higher until August-September.
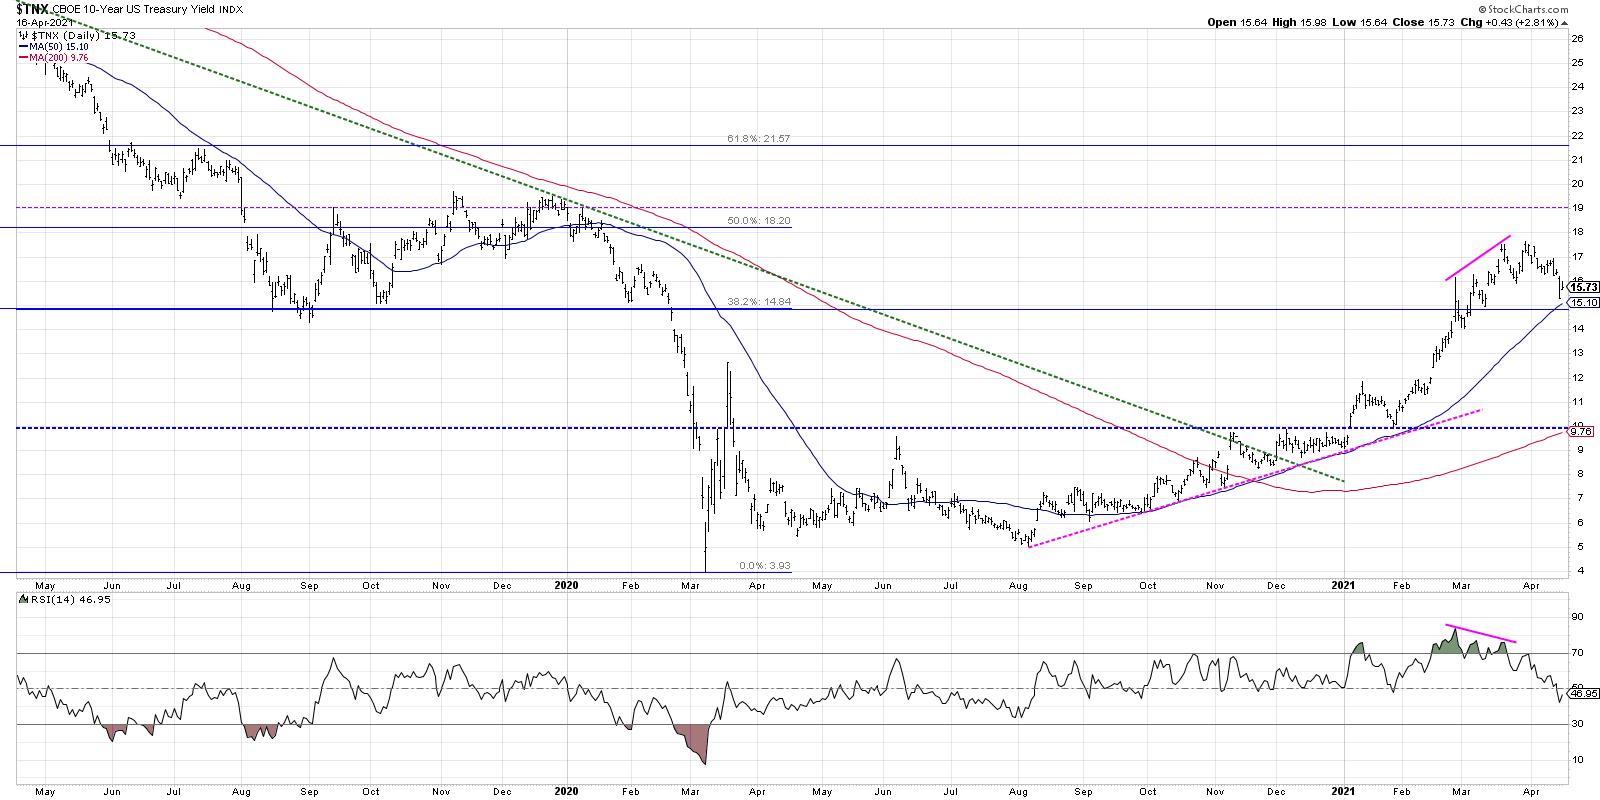
This rise in interest rates was the key catalyst for value-oriented sectors like Financials and Industrials to begin a solid stretch of outperformance through mid-March of this year.
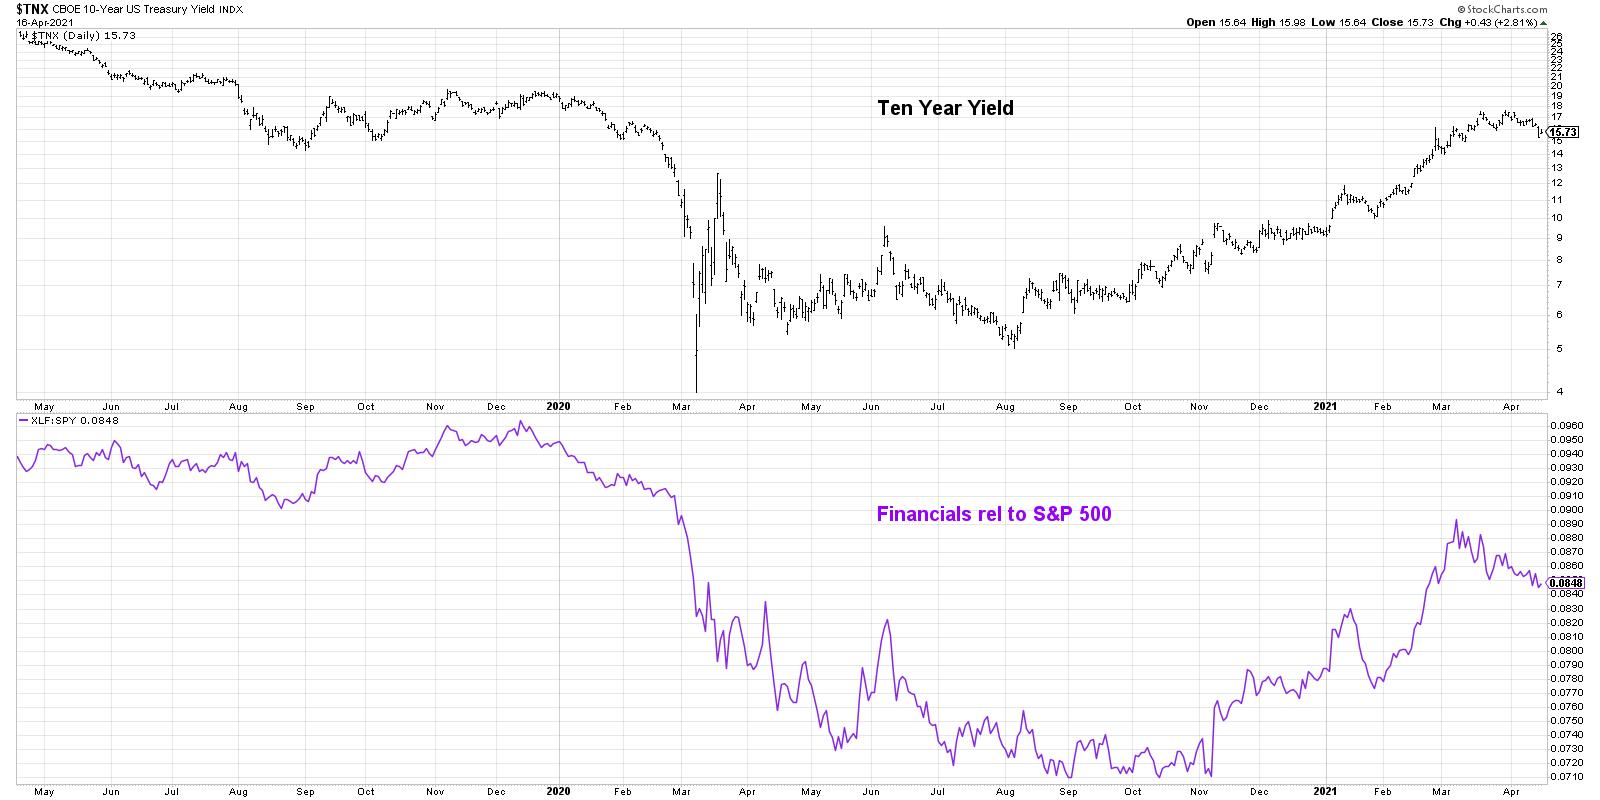
Look at how the chart of the ten-year changed, however, as the yield moved higher in mid-to-late March while the RSI sloped lower. This bearish momentum divergence suggested an upside exhaustion in rates and a likely rally in bond prices. This bounce higher for bonds certainly occurred, which caused Financial stocks to give back some of their recent gains. The chart below shows the clear relationship between the ten-year yield and the relative performance of the Financial sector.
So what's next? Rising rates provide a major headwind to the performance of growth stocks. So the recent pullback in rates has caused growth names like MSFT and others to move higher into April.
As long as the ten-year yield remains above 1.5% (which is reasonable technical support based on Fibonacci retracements, as well as the 50-day moving average) then you could argue the recent rally in bonds was an oversold rally and the downtrend will most likely continue. That would indicate a likely boost for Financials and other value-oriented stocks. If bond prices move higher, pushing the ten-year yield below 1.5% and the RSI below 40 for the $TNX, that would suggest that the long-term downtrend in bond prices is not quite upon us and growth may be the area in which to focus.
Either way, the chart of the ten-year yield is the most important chart to watch in the coming days and weeks.
To digest this article in video format, just head over to my YouTube channel:
RR#6,
Dave
P.S. Ready to upgrade your investment process? Check out my free course on behavioral investing!
David Keller, CMT
Chief Market Strategist
StockCharts.com
Disclaimer: This blog is for educational purposes only and should not be construed as financial advice. The ideas and strategies should never be used without first assessing your own personal and financial situation, or without consulting a financial professional.
The author does not have a position in mentioned securities at the time of publication. Any opinions expressed herein are solely those of the author, and do not in any way represent the views or opinions of any other person or entity.


